2003issue C021-4
Constructing divergence-equivalent relative strength index and stochastic oscillators
A multi-oscillator workspace can be audited by checking which relative strength index and stochastic formulas are strictly increasing rewrites of each other. Those maps preserve the order of highs and lows, so one representative per family is enough for divergence reading, and a bounded oscillator is denormalized only when it must be combined with an unbounded measure.
- Two indicators are equivalent for divergence when a strictly increasing map produces one series from the other, because that map cannot reverse successive highs and lows.
- The signed oscillator built from the same average up-close and average down-close equals twice the matching-lookback relative strength index minus 100, so the pair cannot diverge.
- Fast stochastic percent-K and the inverted high-low range oscillator of the same lookback differ by a constant shift of 100 and are equivalent for divergence.
- A correlation coefficient is a poor test of shared divergence readings. Classifying formulas by a strictly increasing relation is the direct construction check.
A construction audit
Stacked relative strength index and stochastic oscillator formulas can be audited before they are read for price-indicator divergence. Two indicators are equivalent for divergence when a function with a positive derivative produces one series from the other, because that mapping cannot reverse the order of successive highs and lows.
The TradersWeek editorial reading is to treat the workspace as a construction audit: prove which formulas are strictly increasing rewrites of each other, keep one representative per family for divergence reading, and denormalize a bounded oscillator only when it must be composed with an unbounded measure. That framing is editorial and is not attributed to the archive.
What divergence equivalence means
A strictly increasing map is a transform whose derivative is everywhere positive. It rewrites one oscillator formula into another while preserving the order of turning points. Divergence equivalence is the construction relation that follows: successive highs and lows cannot reverse, so the pair cannot form opposite turning-point patterns.
Peak divergence between two indicators is one of three turning-point cases: one rises while the other falls, one stays flat while the other falls, or one rises while the other stays flat. Trough divergence uses the three opposite direction pairs. Price-indicator divergence is that same mismatch, in which one series makes a higher or lower extreme while the other makes the opposite extreme, or one is flat while the other is not.
The relative strength index family
A k-period relative strength index reduces to 100 times the average up-close divided by the sum of the average up-close and average down-close. It records the up-share of total close-to-close movement over that lookback.
The signed oscillator built from the same average up-close and average down-close equals twice the matching-lookback relative strength index minus 100. That rewrite is a strictly increasing map with derivative 2, so the pair cannot diverge. Editorially, one of the two is enough as the family representative for divergence reading.
The stochastic oscillator family
A stochastic oscillator locates the close inside the highest-high to lowest-low range of a stated lookback, optionally after a short moving-average smooth. Fast stochastic percent-K of k periods and the inverted high-low range oscillator of the same lookback differ by a constant shift of 100.
A constant shift is strictly increasing, so the two are equivalent for divergence. Editorially, keep one representative from this family as well.
When a bounded oscillator must be denormalized
The map that sends a unit-interval reading x to one over (1 minus x) minus one over x is strictly increasing. It converts a bounded oscillator into a denormalized oscillator, an unbounded counterpart that keeps the same divergence character.
Applying that map to a 14-period relative strength index scaled into the unit interval sends the 30 and 70 bounds to about -1.90476 and 1.90476. A cross of 50 on the original coincides with a cross of zero on the unbounded series. The same construction on a 5-and-3-period stochastic oscillator maps the 20 and 80 levels to -3.75 and 3.75. The bounded and unbounded plots can look different and still show no mutual divergence.
Adding a still-bounded oscillator to an unbounded one is a weak construction in extreme moves because the unbounded term can dominate by size. Denormalizing first keeps both terms combinable while preserving divergence. Editorially, that step is warranted only when a bounded oscillator must be composed with an unbounded measure.
Denormalized 14-period RSI on the weekly Dow
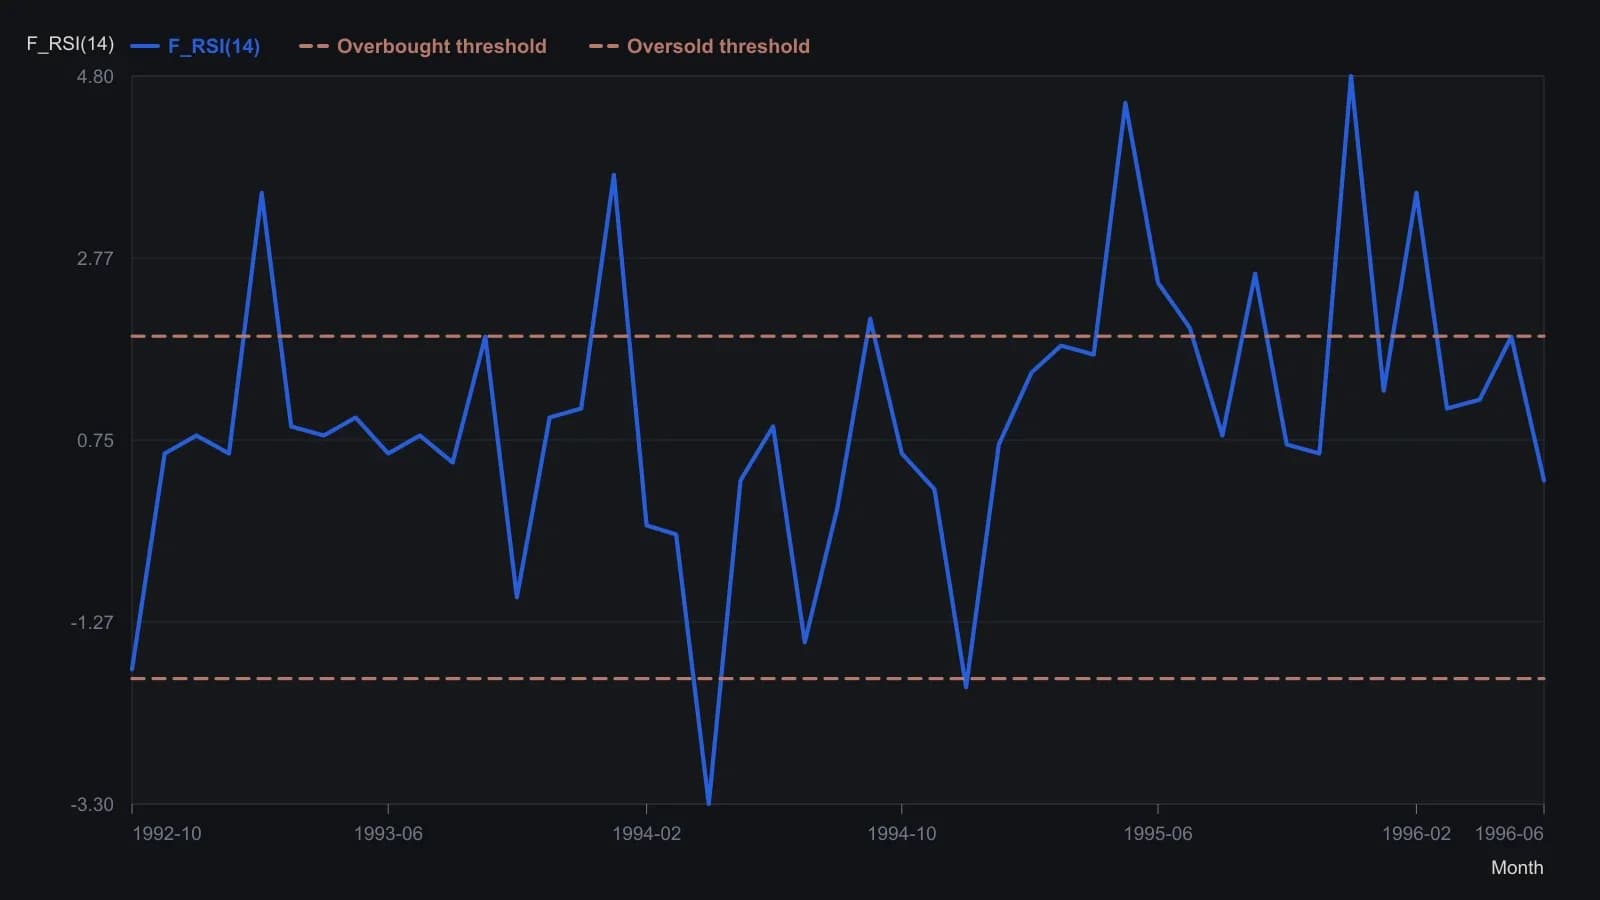
The source defines F_RSI(14)=1/(1−RSI(14)/100)−1/(RSI(14)/100) and maps the 30/70 RSI bands to −1.90476 and 1.90476. The printed figure is weekly; this series keeps one reading per month. Turning-point heights are only as precise as the raster.
Why correlation is the wrong check
A correlation coefficient is a poor test of whether two indicators share the same divergence readings. Classifying formulas by a strictly increasing relation is the direct construction check.
All readings on this track · 32 readings
- 1989Volume confirmation windows and exponential average construction
- 1990Constructing stochastic %K and %D from range position
- 1990Build a weekly leading sector composite from scaled transports and financials
- 1990Constructing stochastic K and D lines and divergence cues
- 1993Relative strength index events depend on the chosen input combination
- 1995Constructing a dual-horizon force index
- 1996Building a range-normalized divergence index from relative strength index
- 1998Treat RSI as a testable filter rather than a trigger
- 1999Primary-cycle windows, then stochastic confirmation
- 1999Stochastic rules versus buy and hold
- 2001Constructing confirmation filters for RSI overbought and oversold extremes
- 2003Constructing divergence-equivalent relative strength index and stochastic oscillators
- 2003Reverse-engineered RSI as a next-close projection
- 2003Scoring open versus resolved relative strength divergences
- 2003Bull-and-bear-balance from OHLC bar patterns
- 2003Constructing bull and bear balance from session paths
- 2004Four-month rule: auto stocks as a market-regime warning
- 2004Constructing stochastic oscillator bands, crosses and divergence
- 2004Volume as an independent check on price oscillators
- 2004Simple dual confirmation for a short-horizon index-futures system
- 2005Confirm a stochastic divergence by reclaiming the first-swing bar
- 2005Weekly stochastic divergence and a long average on 2005 high-yield entrants
- 2005Predicted averages from related market baskets
- 2006Rank price-oscillator divergences, then filter by trend
- 2006Relative-spread-strength for cycle confirmation
- 2007Weekly breakout stretch and histogram divergence
- 2011A luxury-auction stock as a cross-market bubble warning
- 2014Running-percentile close divergences and trend filters
- 2015Rebuilding the relative strength index from close-to-average gaps
- 2016Constructing higher-high and lower-low stochastic pairs
- 2018Constructing composite relative-strength-index stochastics for reversal confirmation
- 2019Building a smoothed Stochastic oscillator of the Relative Strength Index for Price-indicator divergence checks