2003issue C101-10
Bull-and-bear-balance from OHLC bar patterns
Each bar is classified into eleven bull categories and eleven bear categories from the previous close and the current open, high, low, and close. Category-specific bull-power and bear-power are then averaged and subtracted to form bull-and-bear-balance.
- Same-bar bull-power and bear-power are inferred from the relationships among the previous close and the current open, high, low, and close rather than from a single fixed formula.
- Each bar is assigned one of eleven bull categories and one of eleven bear categories, after which a pattern-specific-calculation supplies the power values.
- The raw power series is described as noisy, so published implementations average the series and subtract to form bull-and-bear-balance.
- Construction choices include exponential-smoothing of each series and of their difference, a moving-average of the raw difference for histogram-display, and separately smoothed powers followed by a second moving-average of the difference.
Same-bar strength without a single formula
The construction infers same-bar bull and bear strength from the relationships among the previous close and the current open, high, low, and close rather than from a single fixed formula.
Bull-power is a same-bar quantity that measures upward reach from a case-specific reference chosen by how the current open, high, low, and close sit relative to the previous close. Bear-power is the complementary same-bar quantity that measures downward reach from a case-specific reference chosen by the same OHLC relationships.
The construction is presented as an alternative estimation of bull and bear balance that is intended to avoid drawbacks attributed to two earlier, similarly named power-balance indicators.
A pattern-specific-calculation on each bar
Each bar is assigned one of eleven bull categories and one of eleven bear categories, then a category-specific power calculation is applied.
That assignment is a pattern-specific-calculation: a nested case assignment that maps each bar onto one of a finite set of bull and bear formulas instead of applying one fixed formula to every bar.
The same-bar case logic can be rewritten with intermediate named conditions so bull-power and bear-power remain separately reusable before they are subtracted.
From noisy power series to bull-and-bear-balance
The raw power series is described as noisy, so both series are averaged and one is subtracted from the other to form the finished balance. Bull-and-bear-balance is the difference of separately smoothed bull-power and bear-power, optionally smoothed again, used as the finished balance series.
One published implementation uses exponential-smoothing as a recursive average of length 20 on each power series and a second exponential average of length 5 on their difference.
Another published implementation subtracts bear-power from bull-power and then applies a 30-period moving-average to the difference for histogram-display. Histogram-display is a bar-style plot of the finished balance so the sign and magnitude of each bar are visually separable from a later overlay smoother.
A third published implementation smooths bull-power and bear-power separately with a 20-day moving-average, then smooths the difference with a 30-day moving-average, with both lengths adjustable without rewriting the formula.
TradeStation bull-and-bear balance on S&P 500 e-mini
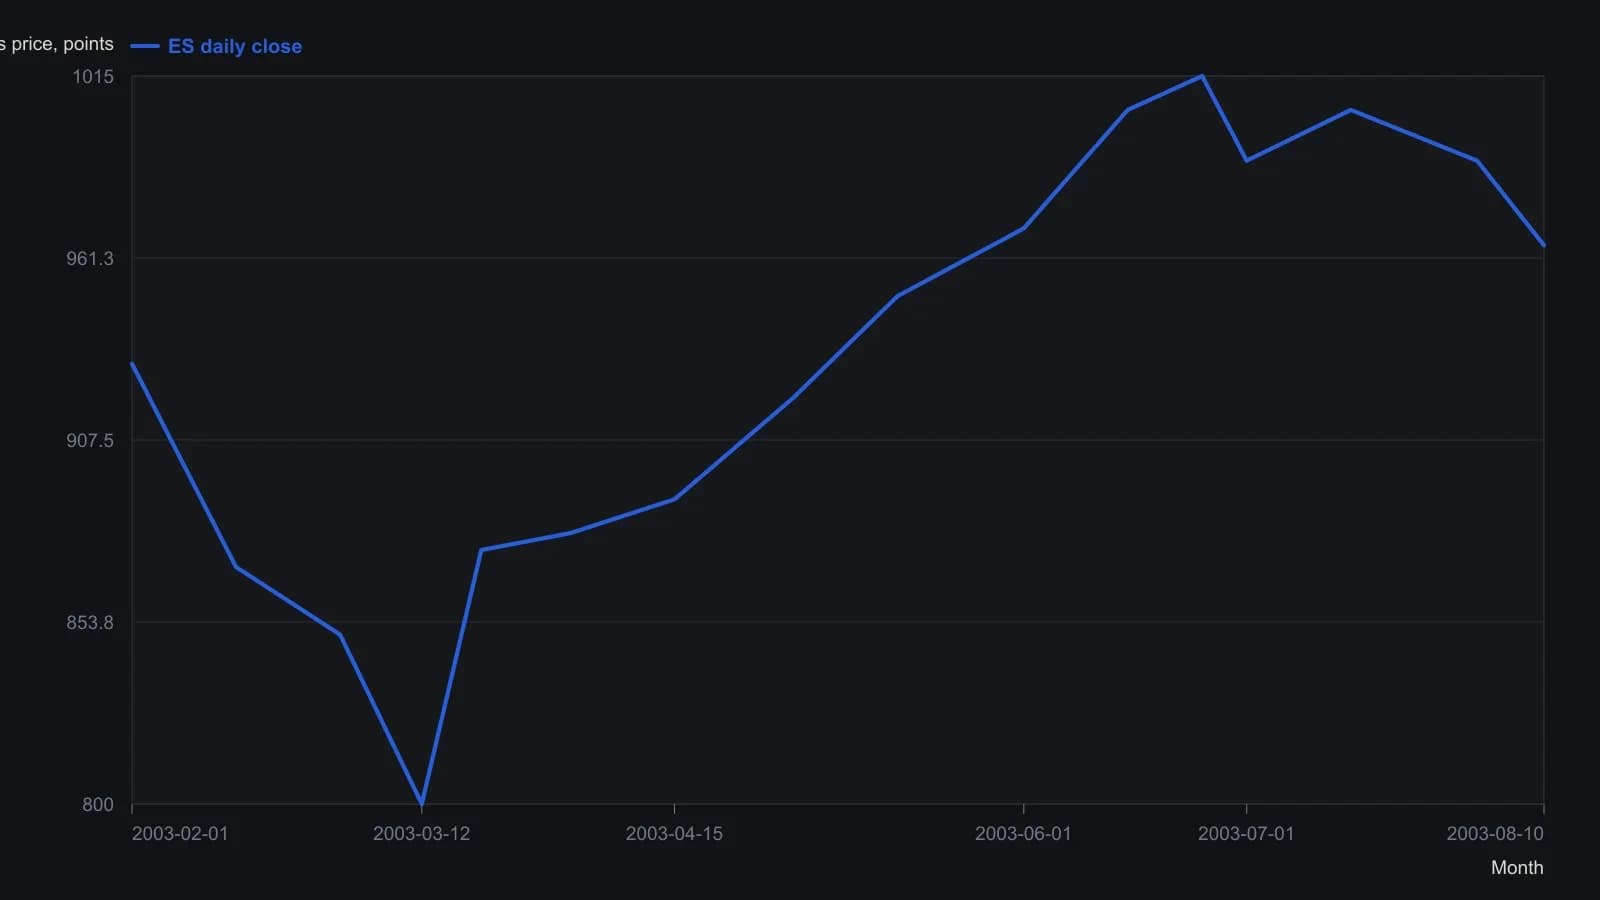
Indicator uses 20-bar exponential averages of bull and bear power and a 5-bar exponential average of their difference, as in the TradeStation tip.
An editorial reading of the finished line
Editorial: price-indicator-divergence is a chart condition in which price structure and the finished balance line fail to confirm each other, treated as a hypothesis rather than a rule. The archive describes how the balance series is built. It does not turn a mismatch with price into a trading instruction.
All readings on this track · 32 readings
- 1989Volume confirmation windows and exponential average construction
- 1990Constructing stochastic %K and %D from range position
- 1990Build a weekly leading sector composite from scaled transports and financials
- 1990Constructing stochastic K and D lines and divergence cues
- 1993Relative strength index events depend on the chosen input combination
- 1995Constructing a dual-horizon force index
- 1996Building a range-normalized divergence index from relative strength index
- 1998Treat RSI as a testable filter rather than a trigger
- 1999Primary-cycle windows, then stochastic confirmation
- 1999Stochastic rules versus buy and hold
- 2001Constructing confirmation filters for RSI overbought and oversold extremes
- 2003Constructing divergence-equivalent relative strength index and stochastic oscillators
- 2003Reverse-engineered RSI as a next-close projection
- 2003Scoring open versus resolved relative strength divergences
- 2003Bull-and-bear-balance from OHLC bar patterns
- 2003Constructing bull and bear balance from session paths
- 2004Four-month rule: auto stocks as a market-regime warning
- 2004Constructing stochastic oscillator bands, crosses and divergence
- 2004Volume as an independent check on price oscillators
- 2004Simple dual confirmation for a short-horizon index-futures system
- 2005Confirm a stochastic divergence by reclaiming the first-swing bar
- 2005Weekly stochastic divergence and a long average on 2005 high-yield entrants
- 2005Predicted averages from related market baskets
- 2006Rank price-oscillator divergences, then filter by trend
- 2006Relative-spread-strength for cycle confirmation
- 2007Weekly breakout stretch and histogram divergence
- 2011A luxury-auction stock as a cross-market bubble warning
- 2014Running-percentile close divergences and trend filters
- 2015Rebuilding the relative strength index from close-to-average gaps
- 2016Constructing higher-high and lower-low stochastic pairs
- 2018Constructing composite relative-strength-index stochastics for reversal confirmation
- 2019Building a smoothed Stochastic oscillator of the Relative Strength Index for Price-indicator divergence checks