1995issue C041-7
Constructing a dual-horizon force index
A force series multiplies session volume by the signed close-to-close change. Exponential averages then split that series into a two-day timing overlay used only after a price trend filter and a 13-day control series read against its center line.
- The force series combines close-to-close direction, move size, and session volume, so a large move on heavy volume produces a larger reading than the same move on light volume.
- The two-day exponential average of the force series is a timing overlay applied only after a 13-day exponential average of price has classified an uptrend or a downtrend.
- The 13-day exponential average of the force series is read against its center line for bull control, bear control, or a trendless stall.
- Divergence is a mismatch in which price prints a new high or low while a two-day or 13-day exponential average of the force series prints a weaker extreme.
How the force series is built
The force series is a constructed force index equal to session volume multiplied by the signed close-to-close change. A higher close is positive and a lower close is negative.
Direction, the size of the close-to-close change, and session volume all scale the reading. A large move on heavy volume produces a larger force value than the same move on light volume.
Smoothing and scaling
The unsmoothed series is described as jagged, so exponential moving averages are applied. A two-day span is used for short-horizon timing, and a 13-day span is used for intermediate bull-bear control.
Dividing the force series by the underlying price is presented as a scaling step that keeps those exponential averages more chartable.
Nikkei Dow force index and dual EMAs
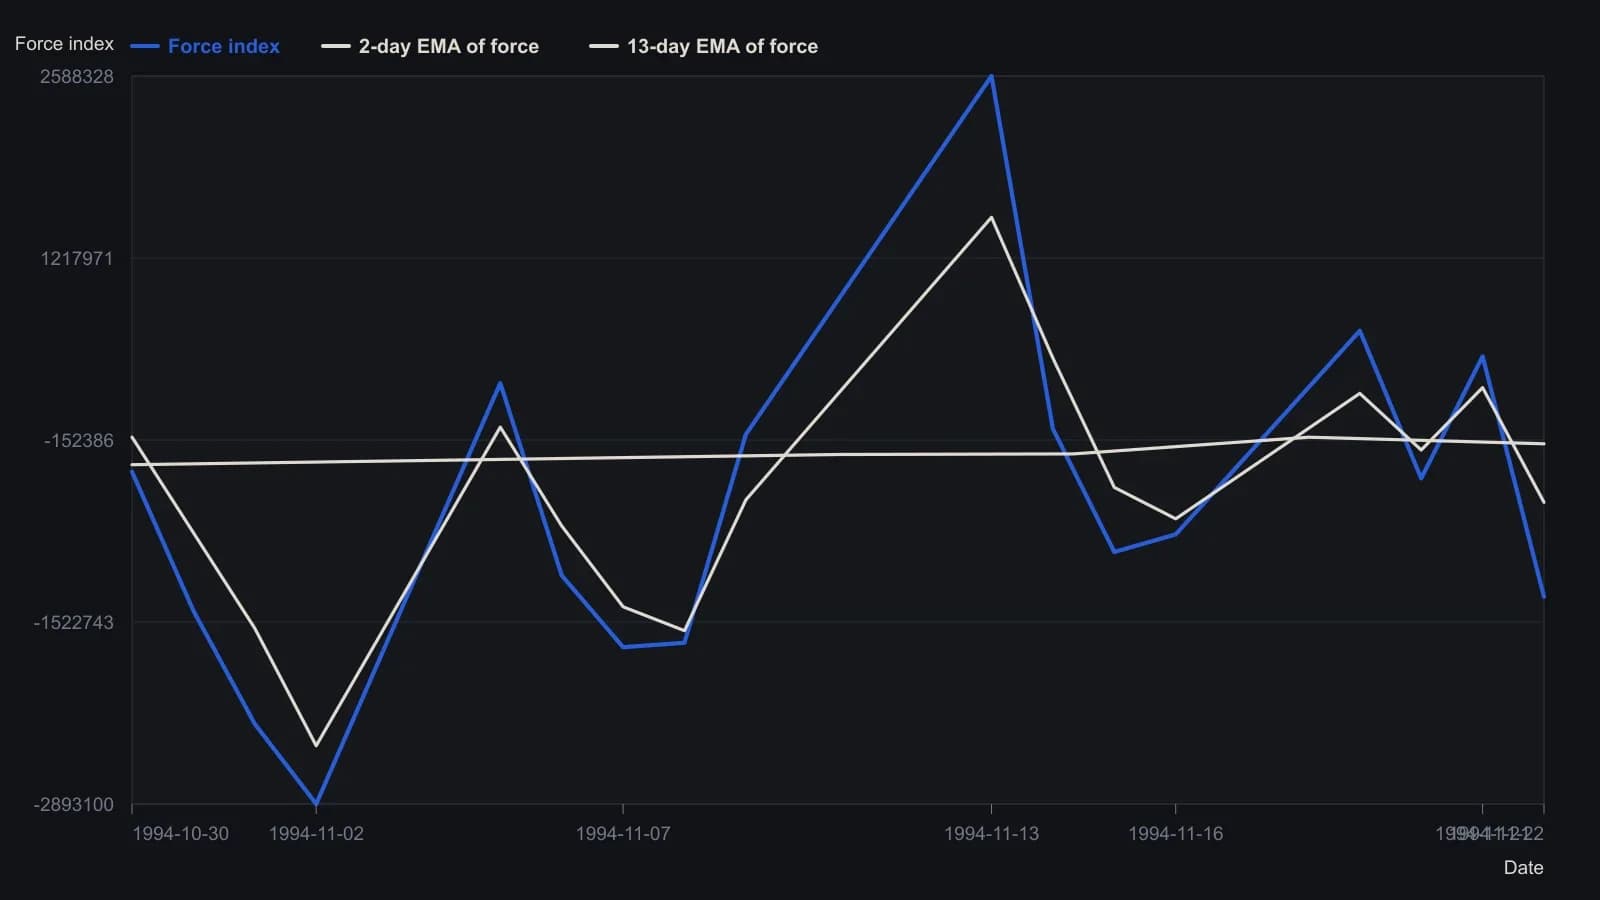
Force is blank on 10/29 because there is no prior close. Two-day EMA is first printed on 10/30; 13-day EMA first appears on 11/16 after the lookback fills.
A two-day overlay after a trend filter
The two-day exponential average is treated as a timing overlay, not a standalone system. It is applied only after a trend-following filter, illustrated as a 13-day exponential average of price, has classified an uptrend or a downtrend.
In that filtered setup, a turn of the two-day force average below zero during an uptrend is the long-location condition. A turn of the two-day force average above zero during a downtrend is the short-location condition.
Illustrated entries use stop orders. A buy stop is placed above the high of the bar that flipped the two-day force average negative in an uptrend. A sell stop is placed below the low of the bar that flipped the two-day force average positive in a downtrend.
Intermediate control against the center line
Intermediate control is read from the 13-day exponential average of the force series relative to its center line. A reading above the line is bull control, and a reading below the line is bear control. A stall near the line is a trendless warning against trend-following methods.
Price and force extremes
Price-indicator divergence is defined when price makes a new extreme while a two-day or 13-day exponential average of the force series fails to confirm that extreme.
A new peak or new low in the 13-day exponential average of the force series is treated as a continuation hypothesis. A lower force peak against a new price high is treated as a loss-of-power warning.
All readings on this track · 32 readings
- 1989Volume confirmation windows and exponential average construction
- 1990Constructing stochastic %K and %D from range position
- 1990Build a weekly leading sector composite from scaled transports and financials
- 1990Constructing stochastic K and D lines and divergence cues
- 1993Relative strength index events depend on the chosen input combination
- 1995Constructing a dual-horizon force index
- 1996Building a range-normalized divergence index from relative strength index
- 1998Treat RSI as a testable filter rather than a trigger
- 1999Primary-cycle windows, then stochastic confirmation
- 1999Stochastic rules versus buy and hold
- 2001Constructing confirmation filters for RSI overbought and oversold extremes
- 2003Constructing divergence-equivalent relative strength index and stochastic oscillators
- 2003Reverse-engineered RSI as a next-close projection
- 2003Scoring open versus resolved relative strength divergences
- 2003Bull-and-bear-balance from OHLC bar patterns
- 2003Constructing bull and bear balance from session paths
- 2004Four-month rule: auto stocks as a market-regime warning
- 2004Constructing stochastic oscillator bands, crosses and divergence
- 2004Volume as an independent check on price oscillators
- 2004Simple dual confirmation for a short-horizon index-futures system
- 2005Confirm a stochastic divergence by reclaiming the first-swing bar
- 2005Weekly stochastic divergence and a long average on 2005 high-yield entrants
- 2005Predicted averages from related market baskets
- 2006Rank price-oscillator divergences, then filter by trend
- 2006Relative-spread-strength for cycle confirmation
- 2007Weekly breakout stretch and histogram divergence
- 2011A luxury-auction stock as a cross-market bubble warning
- 2014Running-percentile close divergences and trend filters
- 2015Rebuilding the relative strength index from close-to-average gaps
- 2016Constructing higher-high and lower-low stochastic pairs
- 2018Constructing composite relative-strength-index stochastics for reversal confirmation
- 2019Building a smoothed Stochastic oscillator of the Relative Strength Index for Price-indicator divergence checks