1999issue C011-10
Multiple time-frame swing-channel trade setups
The workflow maps energy-points on the next-time-period Gann-swing channel, then looks for own-time-period confirmation at a 38.2 or 61.8 Fibonacci internal line, a channel edge, or a hilo-activator flip.
- Trend plus support and resistance belong on the next-time-period. Trades are taken on the own-time-period. A still higher interval is reserved for long-term context only.
- A Gann-swing channel is anchored on two completed valleys or peaks, paralleled through the intervening extreme, and split with 38.2 percent and 61.8 percent Fibonacci internal lines.
- Those edges and internals are energy-points. A three-period hilo-activator close, or a hold-or-fail test at those lines, is the confirmation on the traded bar.
- Keep daily and weekly charts side by side on the same scale. Daily bars are the earlier signal. Weekly trend agreement is the more interesting alignment.
Assign trend to the next-time-period
Multiple-time-frame work assigns trend plus support and resistance to the next-time-period. Trades are taken on the own-time-period. The still-higher interval is reserved for long-term context only.
Worked examples pair wheat 45-minute bars with daily next, T-bond 50-minute bars with daily next, and Microsoft daily bars with weekly next.
How the Gann-swing channel is drawn
An up-market Gann-swing channel connects two defined valleys and projects a parallel from the intervening peak. A down-market channel connects two defined peaks and projects a parallel from the intervening valley. The same construction is used on any interval.
Peak and valley definitions used to mark Gann-swing support, resistance, and change-of-trend are unchanged when those same swings become channel anchors.
Each Gann-swing channel is subdivided with 38.2 percent and 61.8 percent Fibonacci internal lines. Later examples treat those internals as hold-or-fail energy for a breakout bar. The channel edges and those internals are the energy-points the own-time-period setup must answer.
The hilo-activator as the traded-bar test
The hilo-activator is a three-period average of highs used as a buy-stop line and a three-period average of lows used as a sell-stop line. A close through the active line flips the steps and can serve as stop-and-reverse.
Wheat: daily energy-points, 45-minute action points
On the December wheat daily chart a close above the falling hilo buy-stop on September 3 started upswing B-C. A September 14 close above the down-channel and the hilo flagged a breakout whose low sat above the 61.8 percent internal line. A later close above 38.2 percent preceded an October 5 upside break of the new up-channel.
Wheat 45-minute bars carry their own Gann-swing channel, 38.2 and 61.8 internals, and hilo-activator so that daily energy-points can be refined into intraday action points such as 1A and 1B.
December 1998 wheat daily closes and Gann swing
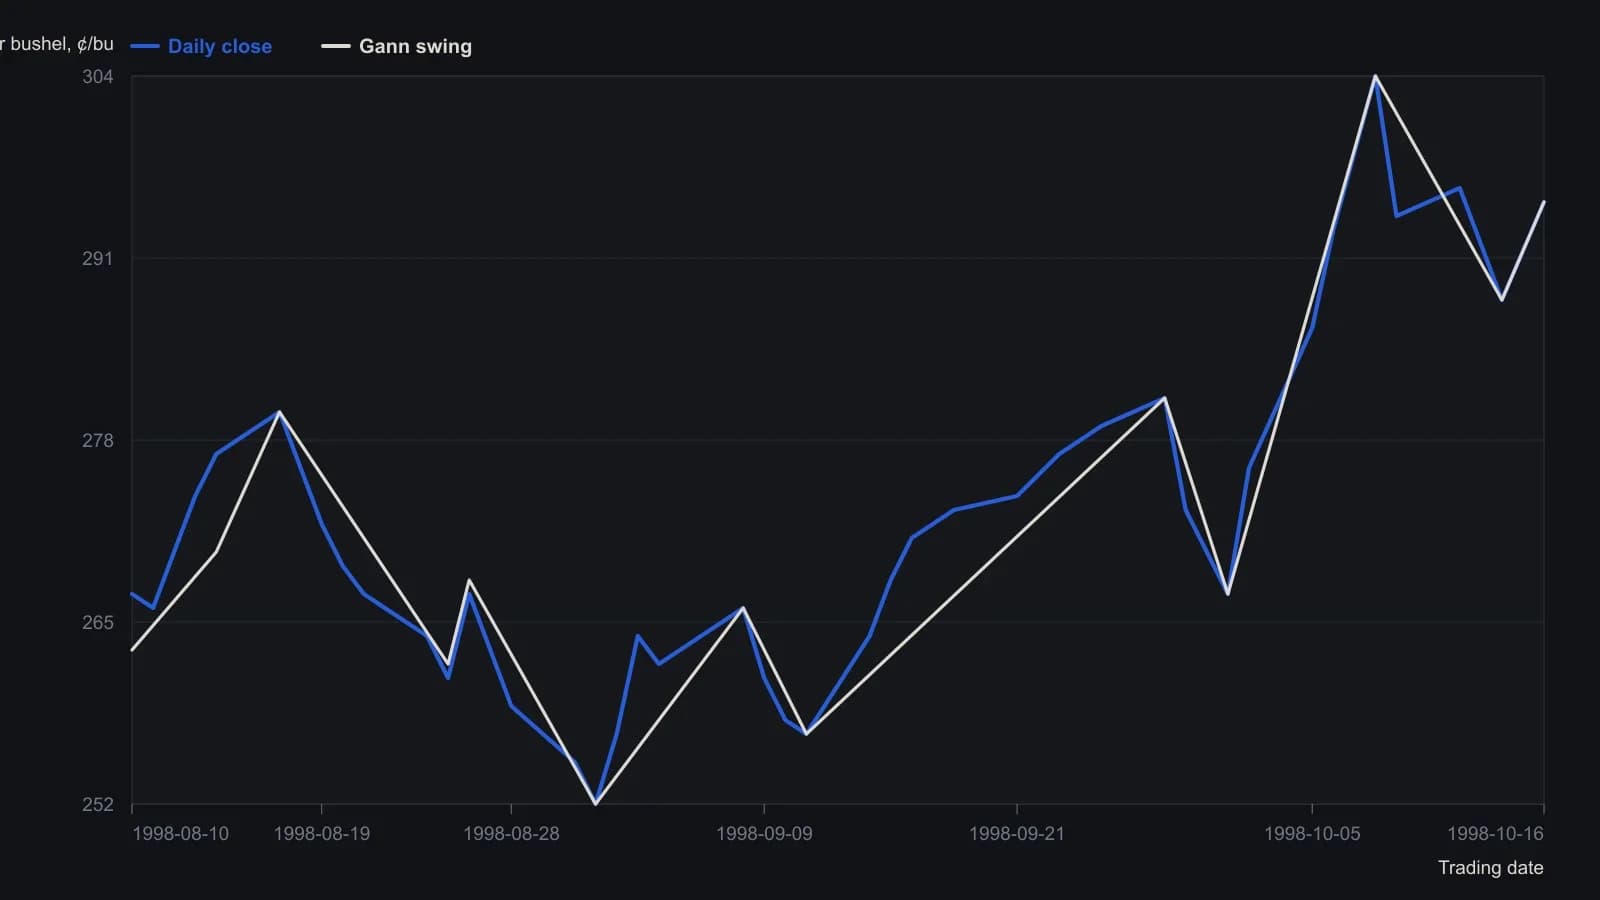
Prices are estimated to the nearest cent from a 10-cent grid on a candlestick raster, so a given close can be off by about two cents. The 3 September, 14 September and 5 October sessions are the article's bars 1, 2 and 4.
T-bonds: daily bars after the weekly turn
In the T-bond sequence a daily close above the hilo and the 38.2 percent line at 63-02 held the activator until 77-03. The daily channel broke at 64-11. After the weekly trend turned up at 73-08 the plan was to buy with daily bars rather than wait for the later daily break of the weekly down-channel near 71-2.
Read the geometry on one scale
The teaching close is to keep daily and weekly charts side by side on the same scale so the geometry of rising valleys across intervals can be read together. Daily bars are treated as the earlier signal. Weekly trend agreement is the more interesting alignment.
All readings on this track · 30 readings
- 1982Constructing range resistance from harmonic swing divisions
- 1984Gold swing chart: failed highs, wash-out, and a boxed pivot range
- 1988Remaining life on a percent-filtered swing chart
- 1991Ranking turning points with percentage swing filters
- 1991Five-count swing-chart construction and break rules
- 1992Constructing the Gann quarterly swing from the prior quarter's intraday range
- 1992Audit quarterly swing breakouts with a slower average cross
- 1992Weekly swing invalidation and the trailing stop
- 1992Quarterly swing chart construction and trend duration
- 1998A two-bar swing is unfinished until it names the stop
- 1999Multiple time-frame swing-channel trade setups
- 1999Separate two-bar swing direction from peak-valley trend
- 2000Constructing peak-trough swing reversals
- 2002Swing charts as shared grammar for trading mentorship
- 2002Confirming the last leg of a zigzag trend filter
- 2004When a late trend bends: test the pause before sizing a reversal
- 2006Crude oil swing counts and cycle clusters
- 2006When late rallies flatten: a swing-chart classroom
- 2006Relocating trading certainty to the decision process
- 2008Swing highs, bar-count pace, and the cost-price stop
- 2010Constructing suspect versus confirmed swing trends
- 2010Constructing swing charts from clear bar ranges
- 2010Building price force maps from two-bar swings
- 2010Clear-method swing-chart construction
- 2011Treat a squared-chart swing forecast as a same-day hypothesis
- 2012Cycle mode construction from aligned bandpass swing waves
- 2013Stacked swing lows and breakout retrace tests
- 2015Building swing charts from perceptually important points
- 2015Construct a zztop from perceptually important points
- 2016Isolating swings with percentage trend thresholds