2001issue C071-3
Constructing relative-strength ratios for spreads and rotation
Comparative relative strength is built by dividing one freely traded price by another and plotting the quotient as a continuous line. Locking that numerator and denominator lets one trade be read as an intermarket ratio, a futures spread, or sector relative strength before any trendline is drawn on the line.
- Comparative relative strength is a two-price quotient plotted as a continuous relative-strength line, not a same-security oscillator of one series against its own past.
- A rising relative-strength line means the numerator is outperforming the denominator, even when both prices are falling.
- The same construction is used for intermarket ratios, futures spreads, and sector relative strength.
- Relative-strength series are treated as trendable, so ratio trendlines and other reversal tools come after the pair is locked.
Build the quotient first
Comparative relative strength is constructed by dividing one freely traded price by another and plotting the quotient as a continuous line. That two-security ratio is the relative-strength line, used to judge outperformance rather than standalone direction.
That two-security ratio is distinct from a same-security oscillator. The oscillator compares one series only with its own past over a fixed lookback. The ratio constructed here compares two freely traded prices with each other.
Bond-to-gold relative-strength ratio, 1993–1998
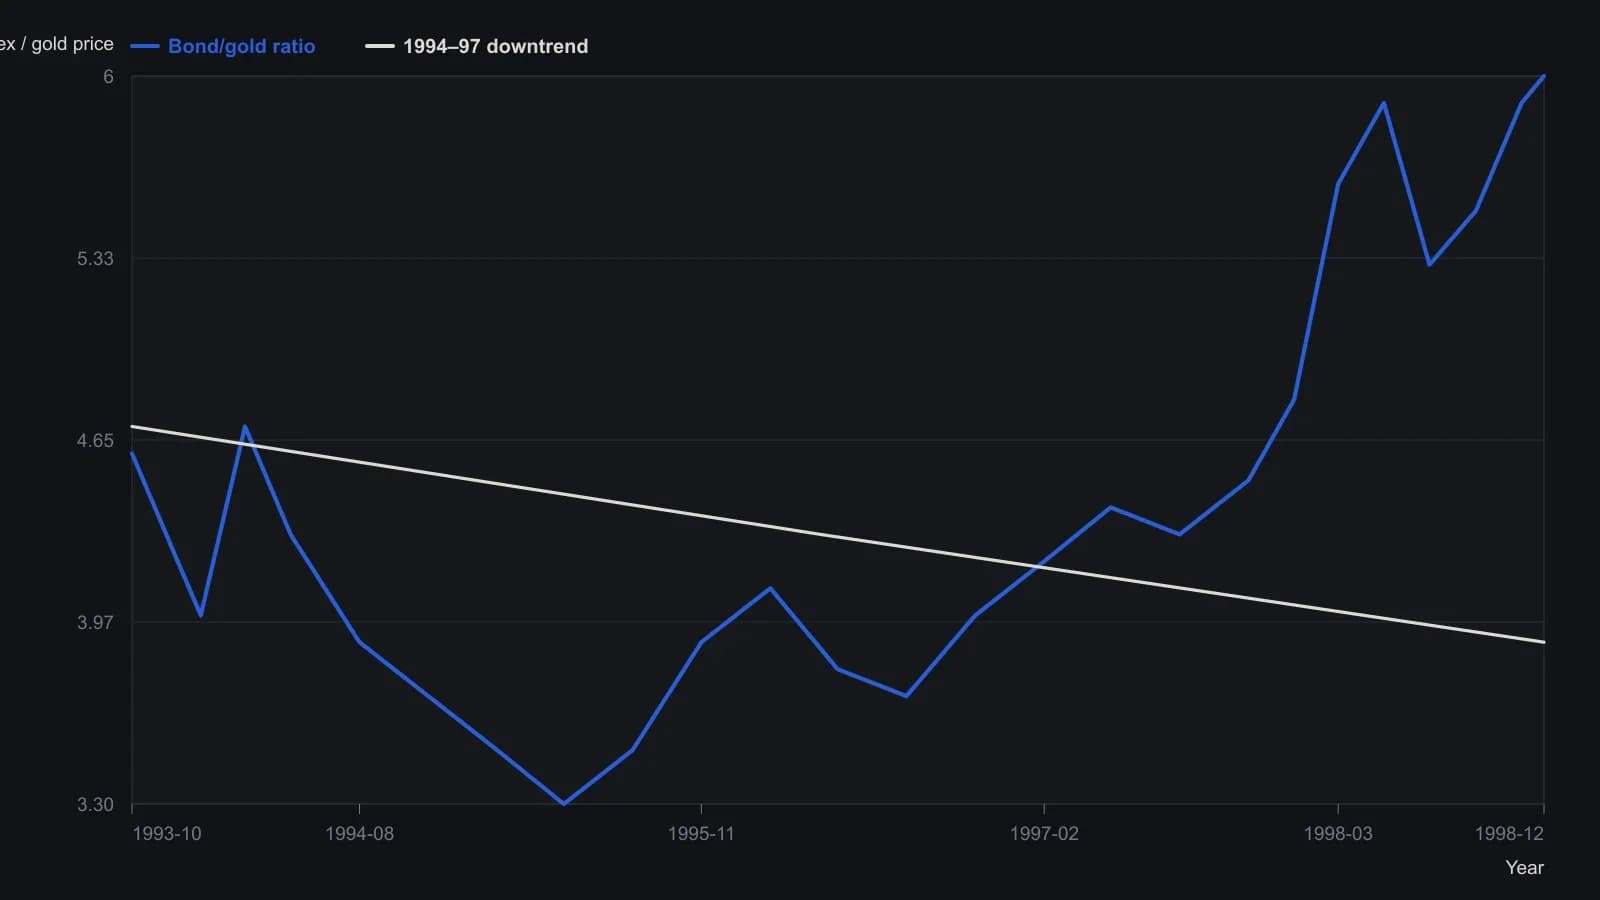
Read off the raster to about 0.1 ratio points. The November 1996 break date is stated in the article; the sloping reference line is the downtrend drawn on Figure 1, not a fitted model.
A rising line is outperformance, not direction
A rising relative-strength line means the numerator is outperforming the denominator. It does not mean the numerator is necessarily advancing in its own price.
Both series can fall while the ratio still rises. In the construction example, a market declines 20 percent and a stock declines 10 percent, and the relative-strength line can still rise.
The same construction across markets
The same construction is used as an intermarket regime read. One intermarket ratio is bonds to gold. An upside break on that line was shown with bonds advancing and gold declining.
When two equity markets are both in bullish price trends, the ratio line is used to identify which market is outperforming the other.
A 1990 break of a 22-year up trendline on a Japanese-versus-US equity ratio was presented as ending a multi-year leadership stretch. The ratio then fell from 115 to around 10, with a later reversal defined as a month-end reading above 15.0 after an 11-year down trendline.
Spreads and sector relative strength
In futures, a spread between two commodities or between a distant contract and a nearby one is treated as a relative-strength construction. That form is used when the relationship has diverged from a typical alignment.
Sector relative strength can decline while both the sector and the broad market are still rising. An advancing absolute-price trend can coexist with underperformance versus other groups.
Apply reversal tools after the pair is locked
Relative-strength series are treated as trendable and therefore eligible for the same reversal tools applied to price, including patterns, trendlines, and moving-average crossovers. A ratio trendline is drawn on the quotient itself to mark when leadership between the two series may be reversing.
All readings on this track · 10 readings
- 2001Constructing relative-strength ratios for spreads and rotation
- 2001Sector rotation, timing and leverage as a regime case study
- 2004Read one stock idea as a late-cycle puzzle
- 2004Always-on delayed-weak and live-strong sector sleeves
- 2012Building a sector-rotation histogram from rate-of-change spreads
- 2012Constructing a bull-bear sector rotation overlay
- 2012A relative-performance heatmap for pairs trading and sector rotation
- 2014Evaluating an annual contrarian sector rank-rotation
- 2014A ranking workflow that treated sector rotation as an abstention procedure
- 2015A nine-sector sleeve drill on the business-cycle map