1992issue C071-5
Commodity-bond ratio as an equity regime overlay
This case study builds a commodity-bond-ratio and reads it as an inverse-overlay on the S&P 500 cash index. Editorial interpretation: grade an equity trendline break against whether that ratio has already broken, stalled, or completed a ratio-double-top.
- The commodity-bond-ratio is formed by dividing a Commodity Research Bureau commodity index by Treasury bond futures prices, and its slope is read as an inflation-pressure-reading.
- The same slope carries a portfolio-context-mapping that emphasizes commodities over bonds when the ratio is rising and bonds over commodities when it is falling.
- The case study reads the ratio and the S&P 500 cash index as an inverse-overlay and marks turns with a ratio-trendline or a ratio-double-top.
- Editorial interpretation: before treating an equity trendline break as a standalone event, ask whether the commodity-versus-bond line has already broken, stalled, or completed a two-peak turn.
Grade the stock move against the ratio
The archive case study places a commodity-bond-ratio next to the S&P 500 cash index so that an equity move is read against a commodities-versus-bonds backdrop. Editorial interpretation: before treating an equity trendline break as a standalone event, ask whether that relative-strength line has already broken, stalled, or completed a two-peak turn.
That habit rests on a three-sector-linkage. Commodities, bonds, and equities are read together rather than as isolated charts.
How the overlay is constructed
The overlay is constructed by dividing a Commodity Research Bureau commodity index by Treasury bond futures prices. The resulting line is the commodity-bond-ratio.
An inflation-pressure-reading assigns meaning to the slope. A rising reading is described as commodities outperforming bonds with inflation pressure increasing. A falling reading is described as bonds outperforming commodities with inflation pressure decreasing.
The same direction carries a portfolio-context-mapping. A rising ratio is mapped to an emphasis on commodities over bonds. A falling ratio is mapped to an emphasis on bonds over commodities.
The case study states that a rising ratio is generally associated with a negative equity backdrop and a falling ratio with a more positive one. That pairing is the inverse-overlay.
Trendlines and a double top on the ratio
The ratio is treated as a line that can be analyzed with trendlines and breakouts to identify turns. A ratio-trendline is a sloping line drawn on the commodity-bond-ratio and used to mark a break, stall, or confirmation, the same way a trendline is used on price.
A ratio-double-top is a two-peak formation on the commodity-bond-ratio used to mark a potential turn in the commodities-versus-bonds regime.
Opposite trends from mid-1987
From mid-1987 through mid-April 1992, the S&P 500 cash index and the ratio are described as generally trending in opposite directions. Several ratio peaks are described as coinciding with equity upturns, including turns at the end of 1987 and in autumn 1990. A rising ratio is noted ahead of the 1987 equity break.
Ratio upturns in the spring of 1988 and in late 1989 are described as coinciding with less supportive equity conditions. The late-1989 turn is characterized as the more negative coincidence.
S&P 500 versus the CRB Index / Treasury-bond ratio, mid-1987 to April 1992
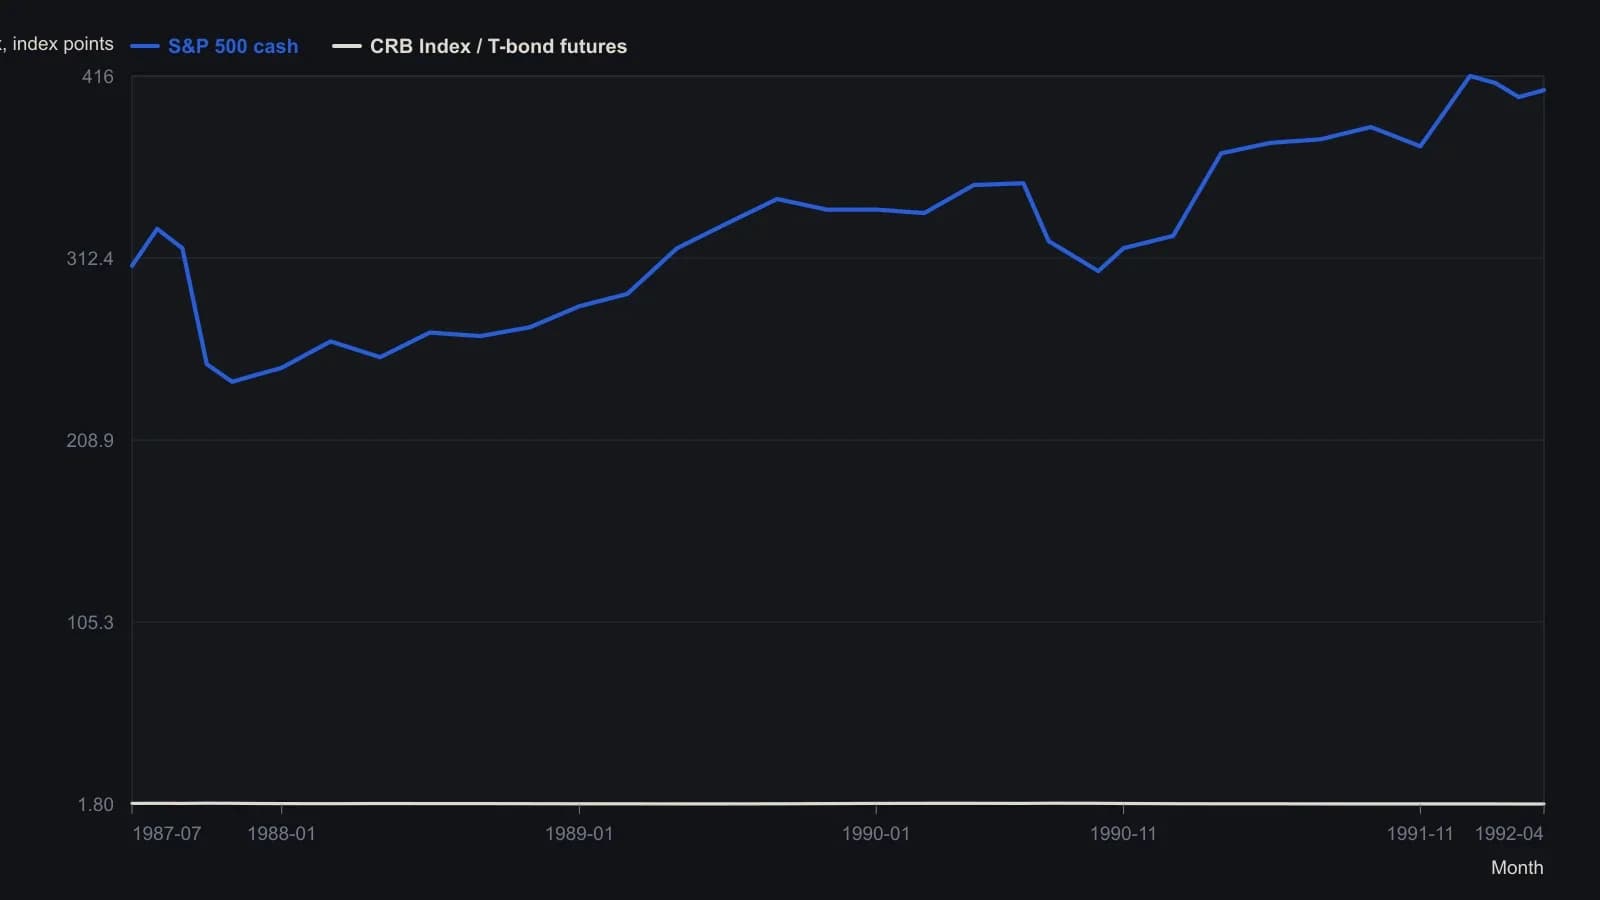
No numerical table appears in the article. Weekly-looking traces were sampled from the printed Figure 1 raster; y-values are approximate to the chart’s labelled ticks (S&P cash in index points; ratio as CRB ÷ T-bond futures). Trendline annotations on the source page are not reproduced.
A January breakout and a ratio-double-top
In the mid-1989 to April 1992 window, an upside breakout in the ratio in January 1990 is described as coinciding with an equity downturn. A ratio-double-top is identified on the ratio between April and September 1990. Completion of the second peak toward the end of 1990 is described as coinciding with a large S&P 500 advance.
A rebound in the ratio in the spring of 1992 is described as stalling at a declining trendline in a window still treated as supportive for equities.
The November 1991 close-up
From November 1991 to mid-April 1992, a falling ratio in late 1991 is described as accompanying an equity advance to new highs. An early-January upturn is described as coinciding with an equity correction amid commodity strength and bond weakness. An early-April break of the rising trendline on the ratio is described as being followed by the S&P 500 moving above a 13-week declining trendline.
Editorial interpretation: that close-up shows the habit. The equity move above a declining trendline is graded after the commodity-bond-ratio has already broken its rising ratio-trendline, not read in isolation.
All readings on this track · 32 readings
- 1988Reaction length as a trend integrity test
- 1991Sold-out double bottoms as a three-gate inventory test
- 1991A breadth classifier for V-bottoms and W-bottoms
- 1991Precomputed price-ratio clusters and double-top tests
- 1992Bond turning points as a regime check on equity double tops and breakouts
- 1992Commodity-bond ratio as an equity regime overlay
- 1992Gold lead confirmation for commodity-index turns
- 1994Constructing the thousand-line advance-decline indicator
- 1995Evaluating zero-line patterns on a breadth-price oscillator
- 1996Constructing double tops from a resistance retest to a trough break
- 1996Four-stage double-bottom construction
- 1998Double-bottom confirmation and stop placement
- 2000Two-bar reversal construction
- 2001Constructing double tops from failed resistance retests
- 2002Eve-Eve double bottoms: width, confirmation, and overhead resistance
- 2002Constructing Eve-and-Eve and classic double bottoms
- 2003Eve-Adam double bottoms as a two-step classroom test
- 2003Shape contrast then breakout confirmation in Adam and Eve double bottoms
- 2003Reading cyclical bottoms inside secular bear regimes
- 2004A case study of the shark-attack Fibonacci retracement
- 2004Confirming index turns with envelopes, divergence, and breadth
- 2005A five-wave euro/dollar case and the support that still had to fail
- 2007Constructing commodity seasonal indexes for regime context
- 2009Constructing rounded and double-top short setups
- 2010Hourly pattern entries, exits, and abstention as one playbook
- 2016Ugly double bottom after a yearly low
- 2016An unconfirmed stock double bottom next to a confirmed index
- 2016Constructing a range-midpoint moving average
- 2017Evaluating whole-dollar delays on pattern breakouts
- 2018Volume-confirmed bottoms and breakouts with moving averages
- 2018Evaluating double bottoms with a locked stochastic confirmation
- 2019Forex pairs as relative value: yield spreads, support, and a double bottom