1991issue C011-3
Sold-out double bottoms as a three-gate inventory test
A double-bottom is judged sold out when the second visit to a prior low fails to recruit the volume of the first decline. TradersWeek frames that reading as a three-gate inventory test that stays hypothetical until a downtrend-line break.
- A double-bottom is accepted only when the second visit to the prior low fails to recruit the heavy volume of the first decline, which is the sold-out-market reading.
- Volume-price-analysis infers large-trader participation from the pairing of each price swing with expansion or contraction in daily volume, not from disclosed positions.
- TradersWeek treats a downtrend-line break as the last gate: the quiet retest is a condition, and the trendline break is what makes the reversal a live hypothesis.
- A post-low advance can be a one-sided psychology adjustment or short-covering bounce that fails without forming a top if buying interest is exhausted.
Three gates before the reversal is live
A double-bottom is a second visit to a prior low that is judged sold out when the retest fails to recruit the volume seen on the first decline. The first test of the extreme is associated with heavy volume from a strong trend. The second test of the same level is expected to print much lighter volume even if news intensity is similar.
TradersWeek frames this, as an editorial reading, as a three-gate inventory test. The first low is where volume spent itself. The second low is accepted only if large-lot selling refuses to reappear. A downtrend-line break is the last gate before the reversal is treated as a live hypothesis.
How volume-price-analysis reads participation
Large professional participation is inferred from the pairing of price movement with daily volume rather than from disclosed positions. Volume-price-analysis asks whether large traders are adding, liquidating, or standing aside by pairing each price swing with expansion or contraction in volume.
Receding volume during a decline is treated as evidence that lower prices are not inducing long liquidation or new short selling by large traders. Existing long holders are potential sellers and existing short holders are potential buyers once price moves against those positions. That latent pressure is potential-opposing-flow.
TradersWeek adds, as an editorial reading, that a markdown on large volume can look like forced selling and later be classed as liquidation-masking-accumulation if the quiet retest shows inventory moving into stronger hands.
The trendline closes the test
A trendline is a line along successive swing highs or lows whose break is used as a discrete change-of-condition signal. In the historical workflow, a near-term uptrend-line break can mark a renewed decline attempt, while a later downtrend-line break is used as the trend-change signal.
Until that downtrend-line break, TradersWeek keeps the sold-out double-bottom, as an editorial rule, in the status of a hypothesis that has not yet cleared its last gate.
The December 1990 bond sequence
In the December 1990 bond sequence, volume expanded when price broke major support and later failed to expand on the assault of the 87-00 area. A near-term uptrend-line break labeled B marked a renewed decline attempt, and a later downtrend-line break labeled C was used as the trend-change signal.
TradersWeek maps this sequence, as an editorial reading, onto the three gates. The expanded break of support is the first-gate spend of volume. The quiet assault of the 87-00 area is the sold-out retest. The break labeled C is the last gate that turns the reversal into a live hypothesis.
A rally after the low can still fail
A post-low advance is left open as a possible one-sided psychology adjustment or short-covering bounce that can fail without forming a top if buying interest is exhausted. The inverse construction is the double-top: a quieter second test of a prior high implies the supporting news has already been discounted.
December 1990 T-bond futures: sold-out retest of 87-00
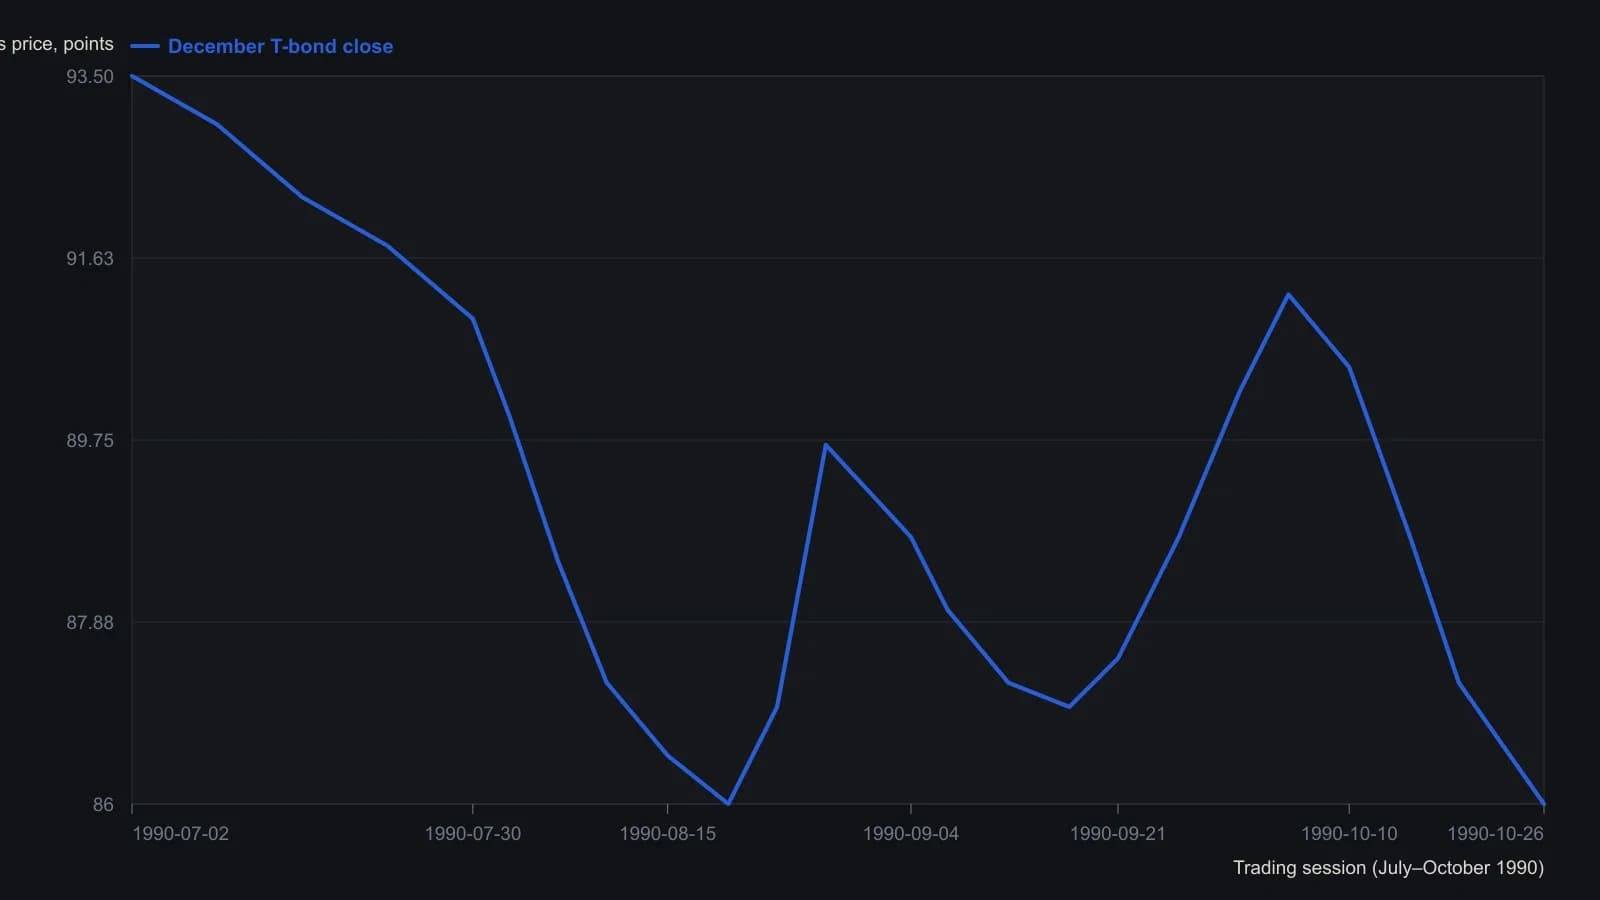
Closes only; OHLC wicks and the volume pane were not digitized. Bond quotes converted from points-and-32nds (89-22 = 89.6875). Raster labels are coarse, so prices are given to the nearest 1/8 point.
All readings on this track · 32 readings
- 1988Reaction length as a trend integrity test
- 1991Sold-out double bottoms as a three-gate inventory test
- 1991A breadth classifier for V-bottoms and W-bottoms
- 1991Precomputed price-ratio clusters and double-top tests
- 1992Bond turning points as a regime check on equity double tops and breakouts
- 1992Commodity-bond ratio as an equity regime overlay
- 1992Gold lead confirmation for commodity-index turns
- 1994Constructing the thousand-line advance-decline indicator
- 1995Evaluating zero-line patterns on a breadth-price oscillator
- 1996Constructing double tops from a resistance retest to a trough break
- 1996Four-stage double-bottom construction
- 1998Double-bottom confirmation and stop placement
- 2000Two-bar reversal construction
- 2001Constructing double tops from failed resistance retests
- 2002Eve-Eve double bottoms: width, confirmation, and overhead resistance
- 2002Constructing Eve-and-Eve and classic double bottoms
- 2003Eve-Adam double bottoms as a two-step classroom test
- 2003Shape contrast then breakout confirmation in Adam and Eve double bottoms
- 2003Reading cyclical bottoms inside secular bear regimes
- 2004A case study of the shark-attack Fibonacci retracement
- 2004Confirming index turns with envelopes, divergence, and breadth
- 2005A five-wave euro/dollar case and the support that still had to fail
- 2007Constructing commodity seasonal indexes for regime context
- 2009Constructing rounded and double-top short setups
- 2010Hourly pattern entries, exits, and abstention as one playbook
- 2016Ugly double bottom after a yearly low
- 2016An unconfirmed stock double bottom next to a confirmed index
- 2016Constructing a range-midpoint moving average
- 2017Evaluating whole-dollar delays on pattern breakouts
- 2018Volume-confirmed bottoms and breakouts with moving averages
- 2018Evaluating double bottoms with a locked stochastic confirmation
- 2019Forex pairs as relative value: yield spreads, support, and a double bottom