2001issue C121-7
Constructing a slanted head-and-shoulders when the chart is tilted
A slanted head-and-shoulders stays a falsifiable construction when the neckline, the volume-price-analysis check, and the measured-move-floor are rebuilt on the same rules used for a flatter pattern. Detrending only changes how the bars are viewed. The original series remains the reference.
- A head-and-shoulders is three failed advances after an uptrend and stays unfinished until price breaks the neckline.
- Volume-price-analysis confirms a top only when the neckline breaks and right-shoulder volume is weak. Excessive volume on that shoulder is evidence that the construction has not completed.
- The measured-move-floor is drawn parallel to the neckline at a distance below it equal to the head's height above it.
- Detrending adds one offset to each bar so a tilted structure can be inspected as flatter, while a broken uptrending trendline can serve as both neckline and exit signal.
Three peaks and an unfinished neckline
A completed head-and-shoulders is constructed as three failed advances after an uptrend: left shoulder, head, then a smaller right shoulder. The pattern is treated as unfinished until price breaks the neckline.
The neckline is the connecting line drawn through the two troughs between the shoulders and the head. It may be horizontal or steeply slanted, and it is the confirmation and projection baseline.
Head-and-shoulders construction on the April 2001 teaching pane
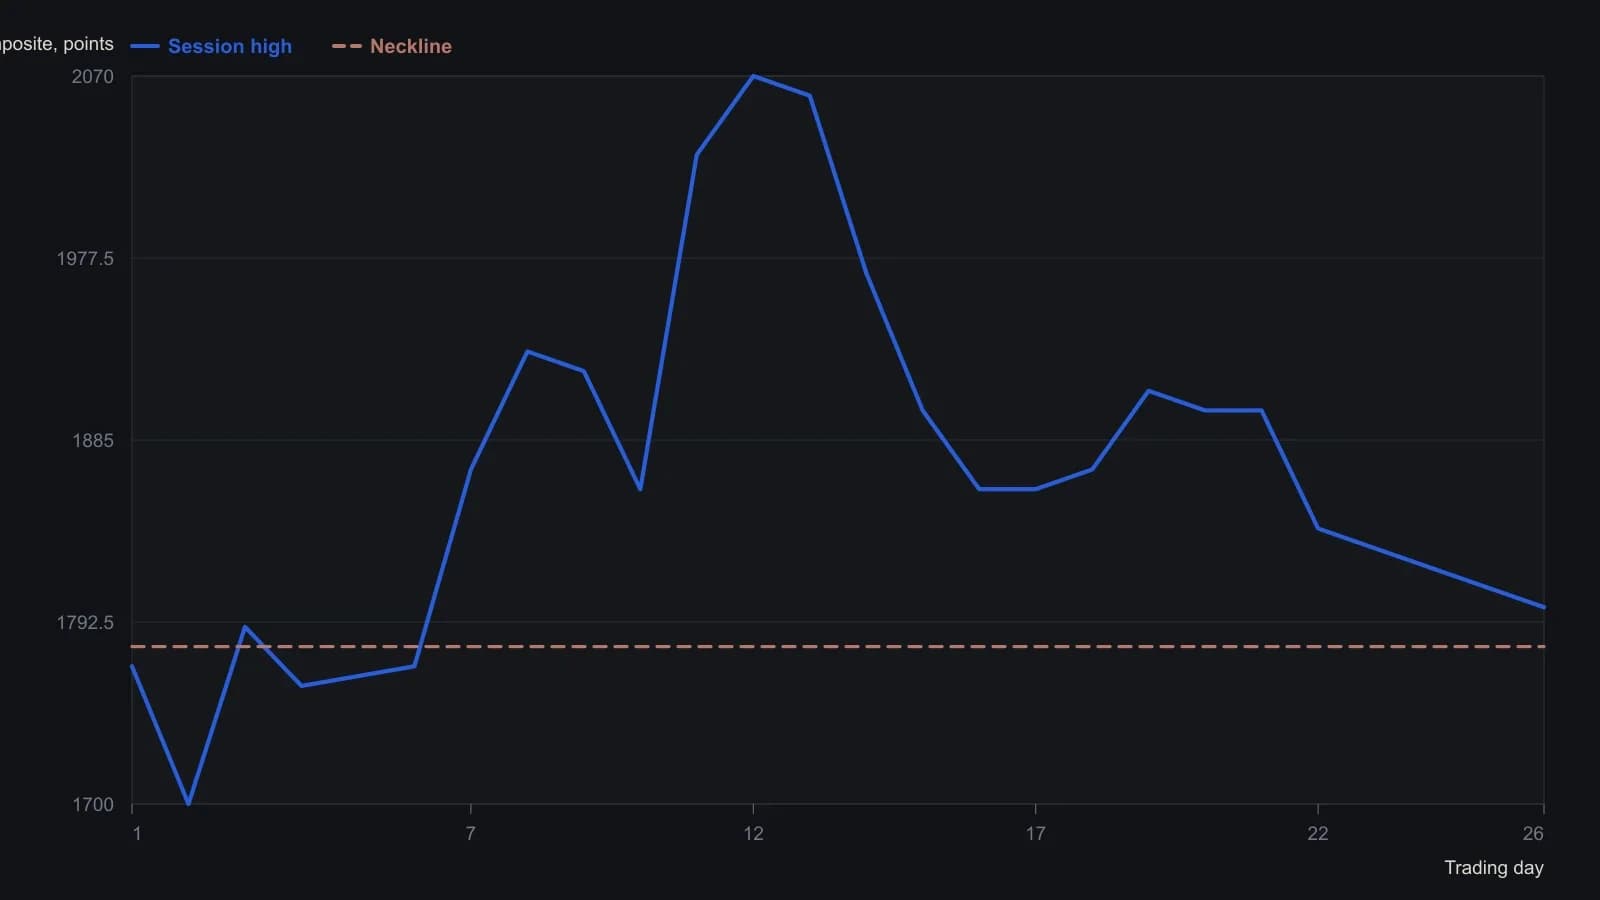
Digitized from the raster; highs rounded to the nearest ten index points. The pane is the detrended window around the 10 April 2001 pivot, so the neckline is drawn flat even though the raw Nasdaq tape was still tilted. The original undetrended series remains the measurement reference.
Volume-price-analysis at a top
Volume typically contracts into the head relative to the left shoulder. A valid top is confirmed only by the neckline break together with weak volume on the right shoulder.
Volume-price-analysis requires that right-shoulder volume weaken for a valid top. Persistent or excessive volume is treated as evidence that the construction has not completed. A developing head-and-shoulders failed after the right shoulder printed excessive volume instead of the required drying-up of volume.
Placing the measured-move-floor
The first constructed objective after a neckline break is a floor placed parallel to the neckline, at a distance below it equal to the head's height above it. That measured-move-floor keeps the projection on the same slant as the neckline used for confirmation.
Slanted necklines and the trendline
Steeply slanted necklines use the same identification and interpretation rules as flatter ones, but they are harder to see and they complete more quickly.
A break of an uptrending support line is treated as an exit signal, and the same line can serve as the neckline of a slanted head-and-shoulders. In this workflow a trendline is that upsloping support line, used both as the neckline and as a standalone break signal when price loses that support.
Detrending as a viewing aid
Detrending is a spreadsheet construction that adds one uniform offset to each bar's high, low, and close. A skewed head-and-shoulders can then be inspected as a flatter structure.
The original series remains the reference. Detrending does not replace the original price scale.
Editorial reading
Editorial interpretation: TradersWeek treats the tilt as a visibility problem, not a reason to change the rules. Rebuild the neckline, apply the same volume-price-analysis test, and place the measured-move-floor parallel to that neckline so the construction stays falsifiable on a slanted chart.
A relative decline, not a finished uptrend
A slanted head-and-shoulders is a predictor of a relative decline, not automatic proof that a long uptrend has ended.
All readings on this track · 37 readings
- 1982Head and shoulders as a three-path completion test
- 1984Stock low clusters as a cycle baseline
- 1985Four-phase construction of the head-and-shoulders reversal
- 1989Volume-confirmed reversal patterns, stops, and measured objectives
- 1991The journal as one checklist for taken and skipped trades
- 1991Head and shoulders as a direction hypothesis
- 1991Candlestick body and shadow construction with three-Buddha peaks
- 1992A three-count drill that binds candlesticks, head and shoulders, and entry rules
- 1997Constructing bump and run reversal channels
- 1998Testing reversal formations in bond futures
- 1999Construction first: extra shoulders, the neckline, and the diamond test
- 1999Dead-cat bounce, rollover, and failed reversals
- 1999Evaluating time gaps in bond reversal patterns
- 2000Constructing head and shoulders and double reversal patterns
- 2001Constructing broadening and complex bottoms
- 2001Constructing a slanted head-and-shoulders when the chart is tilted
- 2002Head and shoulders with dominant-cycle timing
- 2002Trendline breaks, right shoulders, and trailing stops
- 2003Confirmation tests for bearish top patterns
- 2003Commodity top hypotheses on a dollar rebound
- 2003A head-and-shoulders test during a bear rally
- 2004Pattern breakouts need a primary-trend filter
- 2004Reading candlestick closes on trendline and neckline tests
- 2004Candle diagnosis needs Western targets and stops
- 2004Head-and-shoulders neckline construction
- 2005A familiar chart condition is a hypothesis, not a completed decision
- 2005A 50-day ceiling and a rising-floor stalemate
- 2006A complete trading plan from philosophy to checklist
- 2006Thin-market head and shoulders with two averages and MACD confirmation
- 2010Head and shoulders as a playback-tested setup
- 2011Turning a head-and-shoulders outline into a breakout hypothesis
- 2011Volume-confirmed head and shoulders on AIG and Citigroup in 2007
- 2013Constructing head-and-shoulders milestone points
- 2013Head-and-shoulders geometry versus the filter stack
- 2013Algorithmic head-and-shoulders construction
- 2018International relative strength as a double-top case study
- 2019Structure invalidation before comfort-stops