1996issue C061-6
Constructing volume disparity from percent-b
The same percent-b location formula is applied to price and to a volume series because a visual overlay is treated as too subjective. Their quotient is the disparity-ratio, built on 33-period, two-standard-deviation channels with one added in each percent-b expression so readings below zero remain usable.
- The same percent-b location formula is applied to price and to on-balance volume or the negative volume index because a visual overlay is treated as too subjective for measuring how far the two series have diverged.
- The disparity series is the ratio of price percent-b to the volume-series percent-b, computed on 33-period, two-standard-deviation channels, with one added in the percent-b expressions so readings below zero remain usable.
- The working hypothesis is that a price close near the top of its channel while on-balance volume sits in the middle or lower part of its own channel is a condition in which a change in price direction becomes more plausible.
- A spreadsheet reconstruction uses those same channel settings and writes the ratio as one plus price percent-b, divided by one plus volume-series percent-b, to keep the denominator off zero.
The measurement problem
The same percent-b location formula is applied to price and to on-balance volume or the negative volume index. Visual comparison of price with a volume overlay is treated as too subjective for measuring how far the two series have diverged.
The disparity-ratio is the quotient of price percent-b and the percent-b of a volume series, used to turn that visual mismatch into one number.
Channel location as percent-b
Bollinger-bands form a channel around a simple moving average set a stated number of standard deviations above and below that average. In the usual statement the channel is a simple moving average plus and minus two standard deviations.
Percent-b is a location ratio that places an observation between the lower and upper channel bounds. It is the close minus the lower band, divided by the upper band minus the lower band, so 0 sits on the lower band, 1 on the upper band, and 0.5 at mid-channel. A channel-edge is a percent-b reading near 0 or 1, treated as an extreme location on the constructed channel.
The conventional daily specification uses a 20-period average and two standard deviations, with an estimate that about 85 percent of daily closes fall inside that channel. Both the average length and the width can be changed for weekly or monthly bars.
Volume series that share the scale
On-balance volume is a cumulative volume total that adds a session's volume after an up close and subtracts that volume after a down close. It is built on the premise that volume direction tends to precede price direction.
The negative volume index is a price-change accumulator that updates only when volume declines and stays unchanged when volume rises. It is adjusted by the session's percentage price change only when volume falls, on the premise that quieter sessions can reveal accumulation.
Either series can be placed on the same percent-b scale as price, so a location on the price channel can be compared with a location on the volume-series channel.
Forming the disparity ratio
The disparity series is the ratio of price percent-b to the volume-series percent-b, computed on 33-period, two-standard-deviation channels. The 33-week lookback was a judgmental choice meant to keep occasional path differences from dominating band width.
One is added in the percent-b expressions so readings below zero remain usable.
33-week percent-b of NYSE Composite close and of on-balance volume
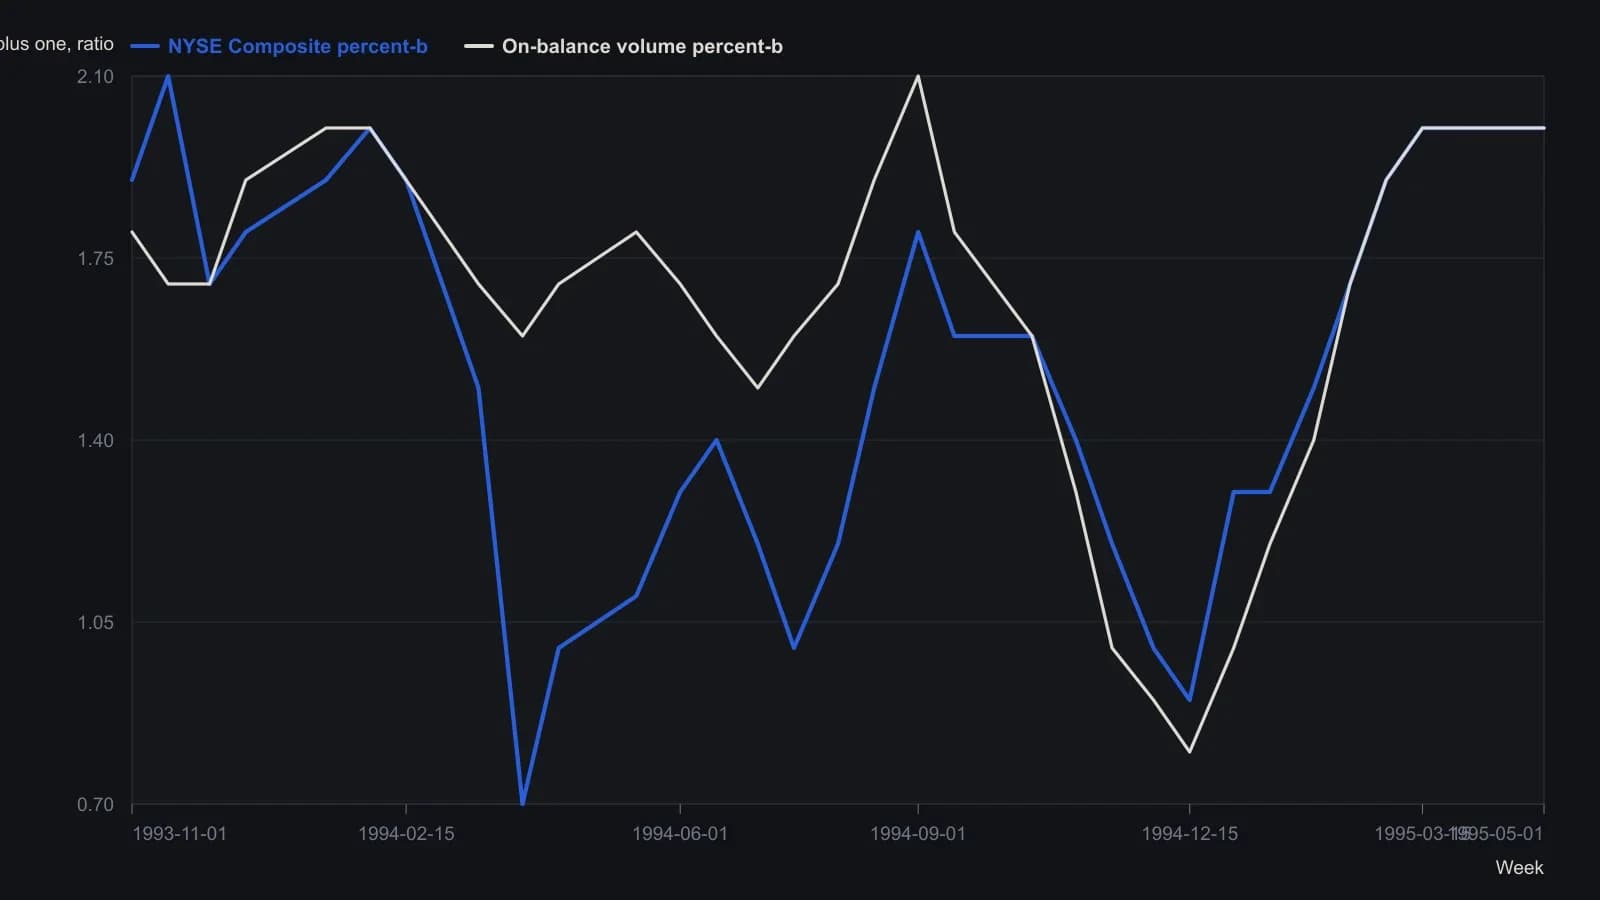
Each percent-b is 1 plus location inside a 33-week, two-standard-deviation channel, so 1 sits on the lower band and 2 on the upper band. Lookback is longer than Bollinger’s usual 20 periods.
The working hypothesis
The working hypothesis is that a price close near the top of its channel while on-balance volume sits in the middle or lower part of its own channel is a condition in which a change in price direction becomes more plausible. That pairing is a price channel-edge against a mid-channel or lower reading on the volume series.
A historical crossing specification
One rule set used weekly NYSE Composite data and a four-week average of the disparity. The on-balance version bought when that average rose through 0.85 or 0.95 and sold when it fell through 0.95. The negative-volume version bought on a rise through 0.95 and sold on a fall through 1.1.
Forty-nine nearby threshold pairs in the ranges 0.92-0.98 and 0.82-0.88 were also examined as a sensitivity check.
Spreadsheet reconstruction
A spreadsheet reconstruction applies the same 33-period, two-standard-deviation bands. It computes on-balance volume by adding or subtracting volume on up or down closes, and it computes the negative volume index from a seed of 100 that updates only on down-volume bars.
The spreadsheet form of the ratio is one plus price percent-b, divided by one plus volume-series percent-b, to keep the denominator off zero.
All readings on this track · 9 readings
- 1986Volume confirmation, the negative volume index, and divergence
- 1990Constructing a signed-range negative volume line
- 1990When quiet-day breadth fails a horizon test
- 1994Stacking scored filters into a hierarchical stock outlook system
- 1996Constructing volume-split and advance-decline breadth signals
- 1996Constructing on-balance volume, volume-price analysis, and the negative volume index
- 1996Constructing volume disparity from percent-b
- 1996Constructing a price-volume percent-B disparity
- 2003Constructing a negative volume index as a moving-average regime test