1997issue C061-8
Constructing bump and run reversal channels
A bump and run reversal is a three-part construction: a lead-in along a rising support trendline, a later bump that lifts well above that line, and a run that returns through it. The archive specifies how to draw the line, when to accept the bump, and how to overlay equally spaced parallels by hand or with linear regression.
- Construct the upsloping support trendline from the lowest low in the review window to the highest minor low before the peak, and keep that line from crossing prices between the two anchors.
- Treat the lead-in as the height and duration baseline: a visibly rising line of at least one month, commonly one to three months, with lead-in height taken as the largest first-quarter gap from a daily high to the line.
- Accept a bump only when that first-quarter gap is at least doubled, then treat the geometry as complete only after the run returns to the original shallower trendline, may pause briefly, and continues through it.
- Place three equally spaced parallels to the base line, by hand or as a linear-regression channel, so the warning parallel and the upper parallel sit on the same slope.
Three sequential parts
The bump and run reversal is a constructed rising-trend pattern with a late acceleration away from support, a rounded or irregular peak, and a later decline back through the same support line. The archive frames the pattern as a measuring sequel to a head and shoulders height construction. That familiar height-projection idea prompted the search for a comparable rule after an upsloping trendline is broken: estimate travel after the line is penetrated.
A complete construction has three sequential parts. The lead-in is the early rising segment bounded below by an upsloping support trendline and used as the height and duration baseline. The bump is the later, steeper lift that carries price well above the lead-in trendline before the structure rolls over. The run is the decline that returns price to the original lead-in trendline and then continues through it.
Lock the rising support line
An upsloping support trendline is constructed from the lowest low in the review window to the highest minor low before the peak, without the line crossing prices between those two anchors. That upsloping trendline is the geometric spine of the pattern: a support line drawn through rising lows without crossing intervening prices.
Flat or near-flat bases are excluded. The lead-in is a visibly rising line, often illustrated near 30 to 45 degrees, and the bump is a later steepening often illustrated near 45 to 60 degrees. The displayed angle depends on the chart aspect ratio.
Height and length of the lead-in
Lead-in height is the largest vertical gap from a daily high to the trendline in the first quarter of the structure. A bump is accepted only when that gap is at least doubled.
Lead-in length is specified as at least one month, commonly one to three months, before the steeper acceleration that starts the bump.
Hand-drawn and regression parallels
A three-line overlay is drawn parallel to the base trendline. The warning parallel is the middle of three equally spaced lines and is placed through the first-quarter high. A later cross of that warning parallel flags that a bump may be forming. The upper parallel is spaced equally above it. A touch or overshoot of the upper parallel is the constructed top-of-bump reference, not a forecast of how far the move will travel.
The same three parallels can be placed with linear regression plus standard deviation or standard error. A linear-regression channel is a statistically placed copy of those parallels, with slope from a least-squares fit and spacing from standard deviation or standard error. The hand-drawn slope is described as approximating the regression slope.
When the run completes the geometry
The geometry is complete only when price returns to the original shallower trendline, may pause briefly, then pierces that line and continues below it.
Kulicke and Soffa 1995 bump-and-run reversal
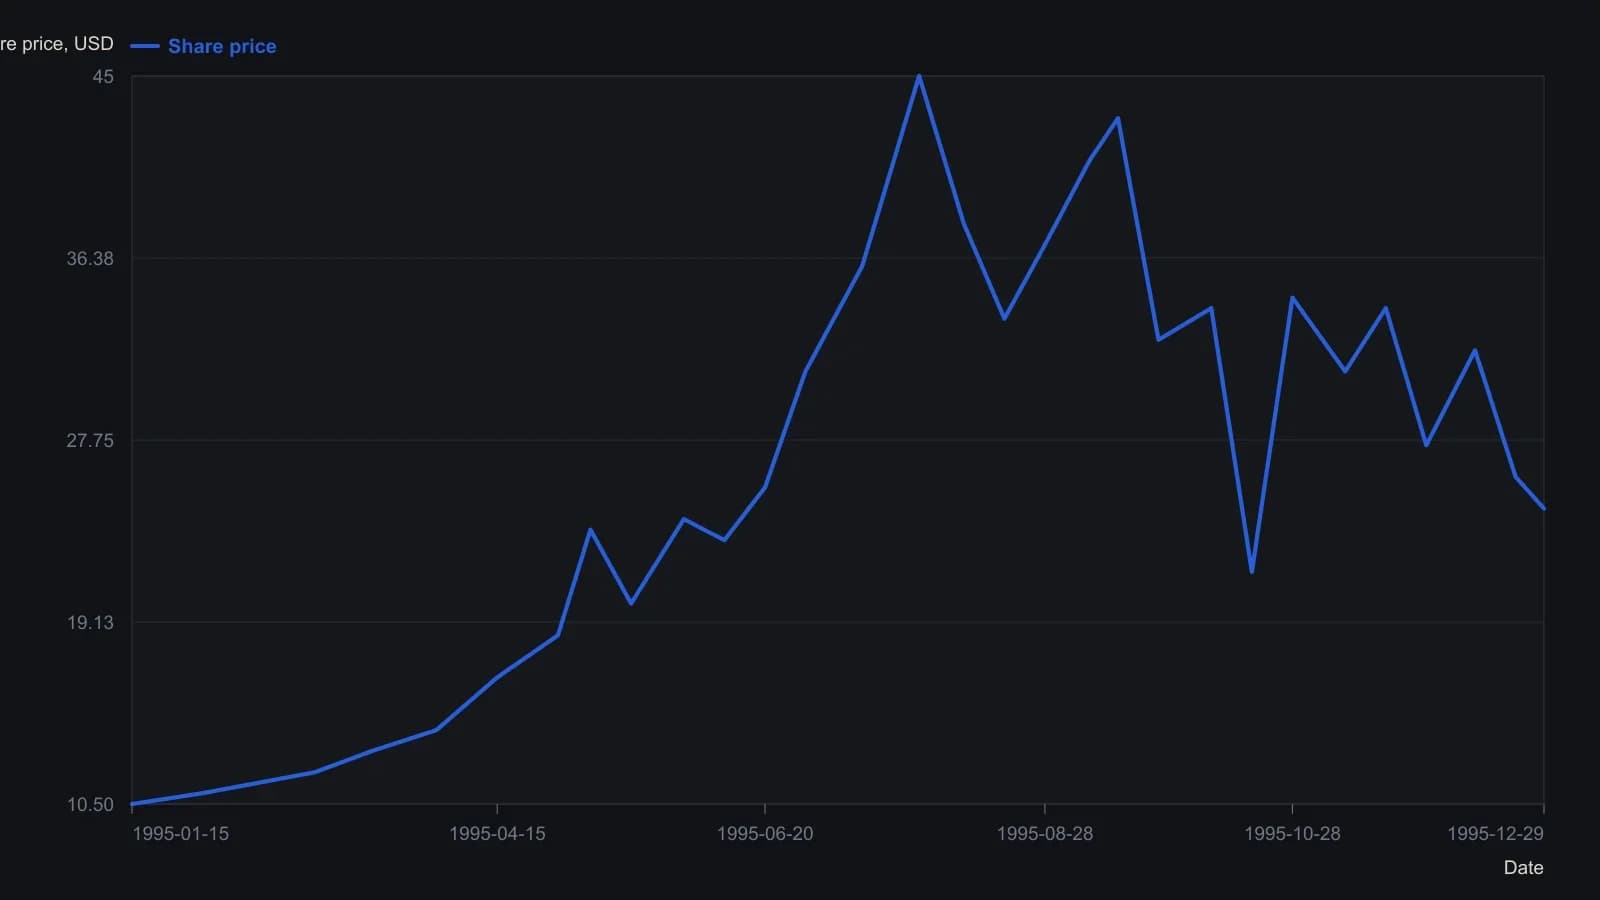
Readings follow the visible weekly structure of the daily bars. The printed scale is two dollars per tick, so values are no finer than half a dollar. The three equally spaced parallel channel lines described in the article are not drawn on this extract and are not invented here.
All readings on this track · 37 readings
- 1982Head and shoulders as a three-path completion test
- 1984Stock low clusters as a cycle baseline
- 1985Four-phase construction of the head-and-shoulders reversal
- 1989Volume-confirmed reversal patterns, stops, and measured objectives
- 1991The journal as one checklist for taken and skipped trades
- 1991Head and shoulders as a direction hypothesis
- 1991Candlestick body and shadow construction with three-Buddha peaks
- 1992A three-count drill that binds candlesticks, head and shoulders, and entry rules
- 1997Constructing bump and run reversal channels
- 1998Testing reversal formations in bond futures
- 1999Construction first: extra shoulders, the neckline, and the diamond test
- 1999Dead-cat bounce, rollover, and failed reversals
- 1999Evaluating time gaps in bond reversal patterns
- 2000Constructing head and shoulders and double reversal patterns
- 2001Constructing broadening and complex bottoms
- 2001Constructing a slanted head-and-shoulders when the chart is tilted
- 2002Head and shoulders with dominant-cycle timing
- 2002Trendline breaks, right shoulders, and trailing stops
- 2003Confirmation tests for bearish top patterns
- 2003Commodity top hypotheses on a dollar rebound
- 2003A head-and-shoulders test during a bear rally
- 2004Pattern breakouts need a primary-trend filter
- 2004Reading candlestick closes on trendline and neckline tests
- 2004Candle diagnosis needs Western targets and stops
- 2004Head-and-shoulders neckline construction
- 2005A familiar chart condition is a hypothesis, not a completed decision
- 2005A 50-day ceiling and a rising-floor stalemate
- 2006A complete trading plan from philosophy to checklist
- 2006Thin-market head and shoulders with two averages and MACD confirmation
- 2010Head and shoulders as a playback-tested setup
- 2011Turning a head-and-shoulders outline into a breakout hypothesis
- 2011Volume-confirmed head and shoulders on AIG and Citigroup in 2007
- 2013Constructing head-and-shoulders milestone points
- 2013Head-and-shoulders geometry versus the filter stack
- 2013Algorithmic head-and-shoulders construction
- 2018International relative strength as a double-top case study
- 2019Structure invalidation before comfort-stops