1994issue C081-7
Keep a wave count as a draft until money flow and a trendline agree
Treat an Elliott wave count as a draft map of turning zones. The archive workflow then asks an independent money-flow reading and a trendline event to agree at the same area before any level is treated as a live, falsifiable hypothesis.
- Elliott wave structure maps a five-wave advance of impulse waves 1, 3, and 5 plus corrective waves 2 and 4, then a three-wave a-b-c decline, with each wave subdivisible into smaller degrees.
- Money flow index is built from the money ratio of accumulated positive to negative money flow and is read like relative strength, including 70/30 extremes, divergences, and failure swings, after checking that an oscillator fits the market condition.
- A trendline through successive highs or lows gains weight with duration and the number of defining points; a 3% to 5% violation can mark reversal or slowing, and a broken steep uptrend often flips to overhead resistance.
- Editorial reading: Fibonacci wave zones stay a draft map until an independent money-flow reading and a trendline event agree at the same price zone.
A wave count maps candidate turning zones
Elliott wave structure is described as a five-wave advance of impulse waves 1, 3, and 5 plus corrective waves 2 and 4, followed by a three-wave decline labeled a, b, and c. Each wave is subdivisible into smaller degrees, so the same hierarchy can appear at more than one scale on the same chart.
Common numerical relationships cited for wave magnitudes include 0.382, 0.500, 0.618, and 1.618. The top of wave 3 is described as very commonly measuring 1.618 times the wave 1 advance. Those Fibonacci relationships locate possible turning zones. They do not, on their own, decide whether a zone is live.
Editorial reading: keep the finished count as a draft map of where a turn might occur, not as a completed trade hypothesis.
Money flow is an independent second reading
Money flow index is calculated from the day-to-day change in average price. Positive and negative money flow are accumulated, the money ratio is positive divided by negative money flow, and the index equals 100 minus 100 divided by one plus that ratio.
The index is read with the same methods used for relative strength, including readings above 70 or below 30, divergences, failure swings, and patterns that appear in the indicator before they appear in price.
Oscillators are described as less useful in trending markets than during consolidations. An indicator should be checked for applicability to the current market condition and to the security under review before its reading is allowed to confirm or reject a wave zone.
In the 1993-1994 worked example, a 23-period money flow index diverged from a new price high near 13.00, failed to break a new downtrend on the indicator, and later failed again on a bounce. That sequence was treated as evidence that the decline was not complete.
After a five-wave advance from about 8.00 to 13.00, a 38.2% retracement implied 11.00 and a 50% retracement implied 10.50, while a 1.618 relation of wave c to wave a implied a minimum target near 8.95. The recorded low of the first decline was 10.38.
A trendline event supplies the third check
A trendline is a straight line through successive price highs or lows and is treated as a support or resistance area. Its significance increases with how long it remains intact and how many data points define it.
Significant penetration of a trendline is interpreted as a reversal or a slowing of the trend. Some technicians look for a 3% to 5% violation of the price level.
After a relatively steep uptrend line is broken, prices frequently attempt one final rally toward prior highs, then treat the former uptrend line as overhead resistance. That support-resistance flip is the kind of event the checklist looks for at a wave-ratio zone.
Confluence makes the hypothesis falsifiable
Editorial reading: a level becomes a live, falsifiable hypothesis only when three independent tools agree at the same price zone. Wave ratios name the zone. The money-flow reading must confirm or fail independently of the count. A trendline break, hold, or flip must occur at that same area.
Disagreement among the three keeps the wave map in draft form. Confluence is agreement among those independent checks, not a stronger version of any one of them.
Playboy Enterprises turning prices, October 1993 to February 1994
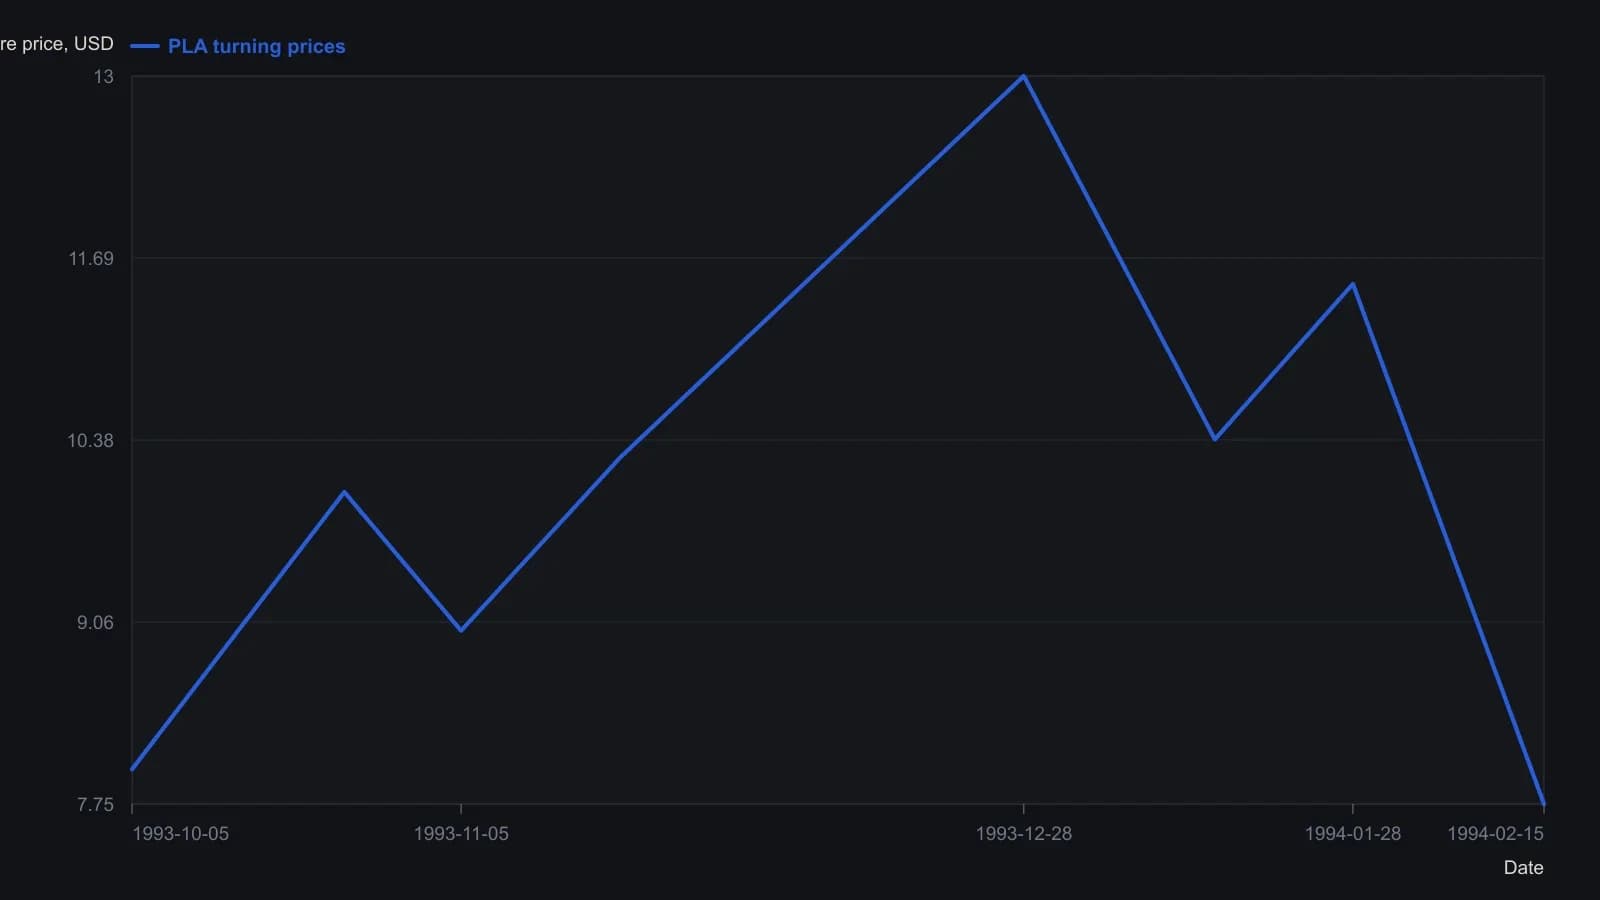
Green fixed money flow at 23 periods for the reviewed window. Calendar days are the article’s early/late/month anchors, not session dates; intra-leg daily path is not shown.
All readings on this track · 13 readings
- 1988Constructing tick-weighted money flow and price divergences
- 1989Four-state money-flow-index as permission for a next-bar breakout-system
- 1989Constructing a suggest-then-confirm Money Flow Index
- 1993Five-rung money flow from signed print volume
- 1993Physics analogies for building cycle and money flow indicators
- 1994Keep a wave count as a draft until money flow and a trendline agree
- 1999Take the rectangular-base breakout from money-flow confirmation, not from a late strength average
- 2004Constructing a volume-flow rule from money flow
- 2006Classify the regime before the bar read
- 2015Constructing a bounded money-flow oscillator from range and volume
- 2016Combining RSI, moving averages, and money flow
- 2018Five-rule technical rating as a rotation filter
- 2020Combining money-flow, RSI, and breadth for dynamic pressure zones