1985issue C061-8
Daily ARIMA range as a filter for intraday stochastic divergence
A daily ARIMA forecast of the next session high, low, and 50 percent confidence envelope was treated as a map of action points, not as an automatic order. Stochastic buy or sell conditions on half-hourly index-futures prices, and mismatches between price and the %D line, were then considered when they formed at or near those levels.
- Daily ARIMA highs, lows, and 50 percent confidence bounds were treated as potential session action points, not as automatic entries.
- The intended workflow looked for stochastic buy or sell conditions at or near those forecasted levels and then reused the same levels as stop-loss anchors.
- A mismatch between a new price extreme and the %D line was used as a long or short filter when it formed near an ARIMA support or resistance level.
- A print beyond the outer 50 percent confidence extremes was read as exceptional same-session strength or weakness and proposed as a last-resort exit for the opposite position.
The combination used a daily ARIMA model to mark the session range and a stochastic oscillator on half-hourly index-futures prices to time conditions. Daily forecasts of highs, lows, and 50 percent confidence bounds were treated as potential session action points, not as automatic entries.
A daily map, not an automatic order
An arima-session-range is a daily autoregressive integrated moving-average forecast of the next session high, low, and a 50 percent confidence envelope. It was used as a map of potential action points rather than as an automatic order. Session behavior versus that forecast was treated as information in its own right.
Timing only near the forecasted levels
The stochastic-oscillator here is a bounded momentum study on ordered intraday prices, shown in both a regular form and a slower smoothed form. Its line crossings and %D path supply timing hypotheses.
The intended workflow looks for stochastic buy or sell conditions at or near those forecasted levels and then uses the same levels as stop-loss anchors after entry. That pairing is a forecast-anchored-signal: an oscillator buy or sell condition is considered only when price is at or near an ARIMA action point.
Half-hourly slow and regular stochastic %K on September 1984 S&P 500 futures
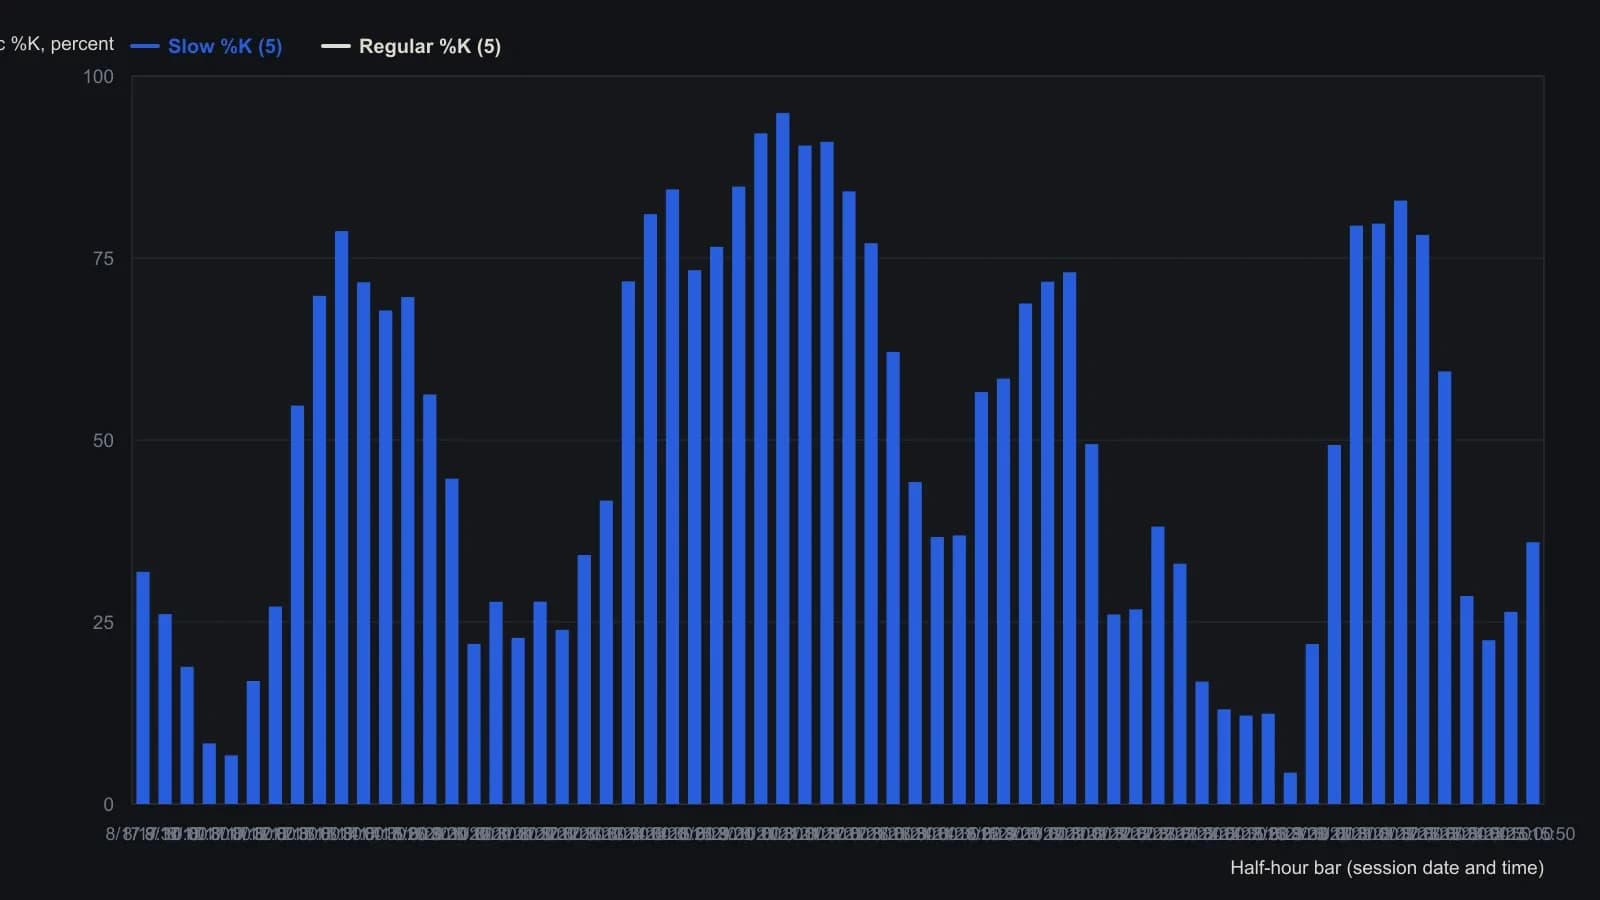
Stochastic columns printed as 32767, 10941, or 0 during the 16 August warm-up were dropped; those cells are uninitialized 16-bit placeholders, not oscillator readings. Times are session clock on each calendar day in the table.
Divergence as a near-level filter
Divergences between the stochastic %D line and price were used as long or short filters when they formed near an ARIMA support or resistance level, including at isolated turning points as well as at cyclic highs or lows.
A price-indicator-divergence is a mismatch between a new price extreme and the corresponding %D reading. It was treated as a confirming or warning condition when it appeared near a forecasted support or resistance band.
When the session disagrees with the map
Prices can overshoot the forecast in the direction of the prevailing trend, and an opening beyond the forecasted high or low was read as added strength or weakness.
A print beyond the outer 50 percent confidence extremes was treated as exceptional same-session strength or weakness, and those outer extremes were proposed as fail-safe exits for the opposite long or short position. The outer-band-fail-safe is those extreme 50 percent confidence bounds, used as last-resort protective exits after a long or short position is open.
Crossings are messier than diagrams
The regular stochastic was described as giving earlier crossings than the slow version, while the slow version was said not to produce right-hand crossovers. Live stochastic crossings were described as less clear than textbook diagrams, and line flutter was noted as a complication for tests on historical data.
After a condition appears, remaining discretionary choices include waiting for a completed crossover versus anticipating it, and exiting on the close versus holding into the next session if no reversal appears.
All readings on this track · 6 readings
- 1982Construct ARIMA forecasts from lag diagnostics
- 1985Evaluating ARIMA envelopes as entry, exit and stop rules
- 1985Daily ARIMA range as a filter for intraday stochastic divergence
- 1990Constructing a short-horizon ARIMA from differenced wheat closes
- 2014ARIMA earnings forecasts versus the announcement-window price reaction
- What an early ARIMA commodity forecast teaches about model limits