2006issue C021-4
A dollar-versus-commodity extreme as a regime case
Late 2004 and 2005 put the US dollar index and the continuous commodity index at opposite extremes last seen together in November 1980. The federal funds rate made those two episodes economically different. A moving-average baseline and a buy-weakness, sell-strength momentum procedure then let the inflation trade be compared with buy-and-hold.
- Read a weak US dollar index against a high continuous commodity index together with gold, oil, and the federal funds rate to classify an inflation-stress regime.
- November 1980 and around September 2005 were simultaneous opposite extremes on the dollar and the commodity basket, but the federal funds rate was near 20 percent in 1980 and about 3.75 percent in the later episode.
- A rising-rate setting can pull foreign buying into dollar assets while commodities stay elevated, so the dollar and gold can advance together rather than only moving in opposition.
- A 2005 gold sequence of moving-average and oscillator reversals, and a buy-weakness, sell-strength momentum procedure at plateaus, is compared with buy-and-hold so the inflation trade stays a defined set of entries, exits, and reversals.
Read the extreme as a regime
Editorial. A dollar-versus-commodity extreme is a case for classifying an inflation-stress regime. The follow-on work is to put a moving-average baseline and a buy-weakness, sell-strength momentum procedure next to buy-and-hold, so the inflation trade is a testable sequence rather than a narrative.
In late 2004 the US Dollar Index reached 80.53, a nine-year low and a degree of dollar weakness seen only twice in the prior 30 years. By September 2005 the Continuous Commodity Index reached 336.56, just below its 20 November 1980 peak of 337.60, marking a 25-year high for the basket.
The dollar and the commodity basket sat at simultaneous opposite extremes in November 1980 and again around September 2005, but the federal funds rate was about 3.75 percent in the later episode versus near 20 percent in 1980.
What followed the 1980 high-rate squeeze
Gold peaked near 875 dollars in January 1980, oil exceeded 40 dollars a barrel, the federal funds rate reached about 19 percent in mid-1981, and the prime rate rose above 21 percent.
After that high-rate squeeze, Mexico devalued the peso by 30 percent in early 1982, the Dow Jones Industrial Average fell 22 percent by July 1982, some US and Canadian home prices dropped by as much as 50 percent, and by early 1983 the US prime rate was back to 10.5 percent with gold near 350 dollars and oil below 30 dollars a barrel.
Same November date, different policy-rate worlds
On 1 November 1980 gold was near 650 dollars an ounce and falling from above 800. On 1 November 2005 it was roughly 465 dollars while the federal funds rate was about 4 percent versus the 1980-81 peaks near 19 percent.
A rising-rate setting can pull foreign buying into dollar assets even as commodity prices stay elevated, creating a regime in which the dollar and gold can advance together rather than only moving in opposition.
Core consumer-price measures can understate household inflation pressure because they do not fully include housing, food, and fuel, two of the largest consumer expenses.
A moving-average and momentum sequence versus buy-and-hold
A 2005 gold case using oscillators, moving averages, and an intermarket predictive moving average reversed at defined points from a 20 June long at 445.90 through later shorts and longs, producing 43.80 dollars of net gain including one 15.60-dollar loss, versus 21 dollars from holding the first long to 31 October.
The illustrated momentum procedure of buying weakness and selling strength at plateaus is presented as outperforming buy-and-hold except in a sustained long-term uptrend, which is described as occurring less than 20 percent of the time.
Gold prices named in the 2005 momentum walkthrough
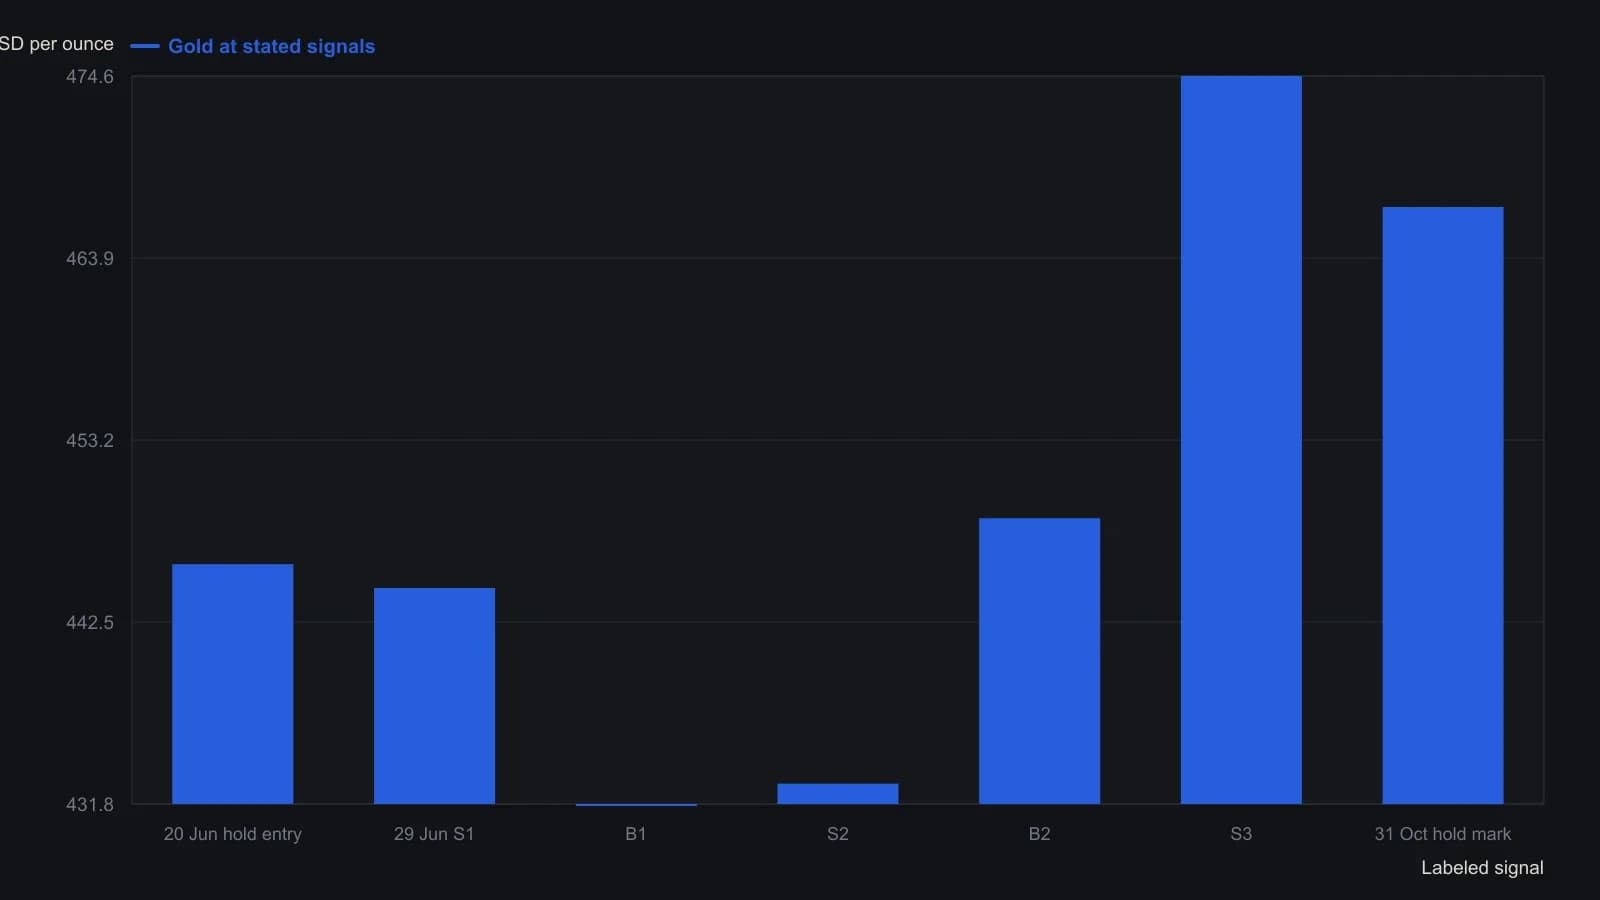
The author scores the closed reverses at 43.80 dollars versus 21 on the hold, excluding commission, and records a 15.60 loss on the short from 433.00 to 448.60. The 11 November buy is named but no print is given, so it is omitted.
All readings on this track · 51 readings
- 1984Half-cycle differencing for momentum signals
- 1987Relative strength evaluation under competing optimization criteria
- 1988Weekly MACD as a two-clock momentum confirmation stack
- 1989Equal-weight zero-cross from smoothed spreads
- 1989Testing relative-strength-index reversal rules against trend continuation
- 1989Smoothed three-day futures filter for index option bounces
- 1989Cycle-length windows for momentum, Relative Strength Index, and stochastic construction
- 1991Filtered rally magnitude as a bull-regime breakout
- 1992Constructing true strength from double-smoothed momentum
- 1992Constructing a double-smoothed true strength index
- 1993When momentum structure and breadth break together
- 1993Constructing double-smoothed range and momentum oscillators
- 1993Constructing a two-parameter relative momentum index
- 1993Building a bounded momentum oscillator with RSI smoothing
- 1993Two-speed oscillators with divergence and trendline gates
- 1993Constructing a relative momentum index from the relative strength index
- 1994Constructing daily advance-decline breadth tools
- 1994Building a composite regime score from monetary climate and weekly trend
- 1994Averaging Relative Strength Index and the stochastic oscillator into one reversal oscillator
- 1995Dividend-yield regression as a hold versus momentum gate
- 1996Jump and hold filters for long-term Treasury yield direction
- 1997Constructing extendedness from a 10 percent swing filter
- 1997A range-expansion oscillator that can refuse its own stretch
- 1997RSI trend permission and Fibonacci pullback rules
- 1998Nested midpoint construction for a range-normalized oscillator
- 1999Evaluating Relative Strength Index momentum with zero-line and threshold rules
- 1999Treat RSI and momentum as three mechanical procedures
- 2000Thrust strength figure from moving-average swings
- 2001Constructing a non-range-bound balance of market power score
- 2004Cleaned breadth oscillator and new-high divergence: a swing-market case file
- 2004Evaluating advance-issues-momentum on a fixed-symbol-basket
- 2004Constructing a trend filter from two adjacent high-low windows
- 2006A dollar-versus-commodity extreme as a regime case
- 2008Zero-centered stochastic bands and bracket stops
- 2012Evaluating engulfing momentum across hold windows
- 2012Staged stops as one mechanical entry and exit procedure
- 2012Stacking a relative-strength-index forecast, a trend filter, and long-only momentum
- 2013Constructing fair-value filters from averages and momentum
- 2014Constructing a multi-window slope divergence entry
- 2015Bandedge trend filter construction with inverse crossover rules
- 2017Opposite rules for index price and volatility momentum
- 2018A three-state overlay that colors a trend only after the line clears the bar
- 2018Half-cycle relative-strength index with a Fisher map for cyclic reversals
- 2018Emotion as a rule input when momentum breaks
- 2018Two-bar body expansion as a momentum breakout construction
- 2019Pair a two-day high breakout with a volume-weighted exit on the same chart
- 2020Building reflex and trendflex cross and extreme entry rules
- 2020Construct a dual-series price momentum oscillator overlay
- 2020A multi-timeframe stochastic as a panel of weekly voters
- 2020Centerline crossovers that compare index momentums
- 2020Multi-timeframe stochastic voting as one mechanical rule