2004issue C061-4
Cleaned breadth oscillator and new-high divergence: a swing-market case file
A long-running workbook rebuilt a common-stock-sample, read a 10-day advance-decline-oscillator for extremes, and used new-high-thinning plus a sentiment-extreme to decide when an overbought bounce was only a rest.
- Exchange-wide advance-decline totals were set aside for a common-stock-sample that dropped preferreds, closed-end funds, foreign listings, real-estate investment trusts, and sub-threshold penny moves.
- The advance-decline-oscillator was read for oversold and overbought extremes in swinging markets. Under swing-versus-trend logic, strong trends were read through negative-divergence rather than oscillator turning points.
- New-high-thinning and a sentiment-extreme sat in the same procedure as the oscillator, so a higher index high was not treated as broadly supported until participation agreed.
- A late-March 2004 downside leg and the April bounce were used to practice rest-versus-correction: an overbought tape after a bounce was not upgraded to a major downturn until new highs and sentiment confirmed deterioration.
A case file, not a confirmation stamp
The archive describes a personal market-statistics workbook maintained over many years. Series were added and dropped, and about 200 daily semi-log stock charts were still posted by hand.
Market-breadth in this file means internal participation measures such as advancers versus decliners and new highs versus new lows, used to test whether an index move is broadly supported.
A cleaned common-stock sample
Exchange-wide advance-decline totals were treated as distorted by preferred shares, closed-end funds, and penny-stock moves. A parallel common-stock-sample excluded foreign listings and real-estate investment trusts and required at least a 12-cent daily move to count as up or down.
The 10-day oscillator and swing versus trend
An overbought-oversold oscillator was defined as the 10-day moving average of net advancers minus decliners. Strings of large negative readings were read as oversold, and strings of large positive readings were read as overbought. That construction is the advance-decline-oscillator in this file.
The oscillator was described as better suited to swinging markets than to strong trends, because a major trend can remain overbought or oversold. In those regimes, divergences were watched instead of oscillator turning points. That is the swing-versus-trend distinction.
Negative divergence and a thinning new-high list
A higher high in a benchmark such as the S&P 500 or Nasdaq against a lower high in that oscillator was labeled a negative-divergence and treated as a warning that the average could decline.
New-high and new-low counts were read the same way as breadth. A higher high in the Dow Jones Industrial Average and the S&P 500 versus the prior Friday arrived with fewer new highs, 336 then 254, and was taken as a tired, thinning advance. New-high-thinning is a rising index accompanied by a shrinking list of stocks making new highs, used as evidence that fewer names are doing the lifting.
Entries and exits as one procedure
Turning-point entries and exits were framed as one multi-indicator procedure combining the breadth oscillator, new-high counts, and sentiment. Extra weight was given to selected series when the readings disagreed and the tape turned choppy.
The late-March 2004 downside leg
A late-March 2004 downside leg was judged complete from three concurrent observations: an oversold tape, the Nasdaq Composite and a semiconductor index resting on still-rising 200-day moving averages, and a correction-minded advisory-sentiment share at its highest reading since 1992. A sentiment-extreme here is a crowded advisory reading used as a contrary condition when it coincides with an oversold tape.
A rest, not a major correction
A later push back toward recent S&P 500 highs was accompanied by far fewer New York Stock Exchange new highs than the prior peak, about 300 versus just over 600 late the previous year. That shrinkage was used to argue that many names would make lower highs.
After an approximately 10 percent Nasdaq bounce off the late-March lows, a maximum overbought reading by the week ended April 9 plus a waning new-high list was framed as a rest, not a major correction, because sentiment had not yet become overly bullish. A later push through old S&P 500 highs was expected to produce a negative new-high divergence and more bullish sentiment by May or June.
TradersWeek editorial reading: rest-versus-correction is the check that keeps a near-term overbought pause after a bounce from being upgraded to a major downturn until participation and sentiment confirm deterioration.
Nasdaq Composite daily with 200-day average, October 2003–April 2004
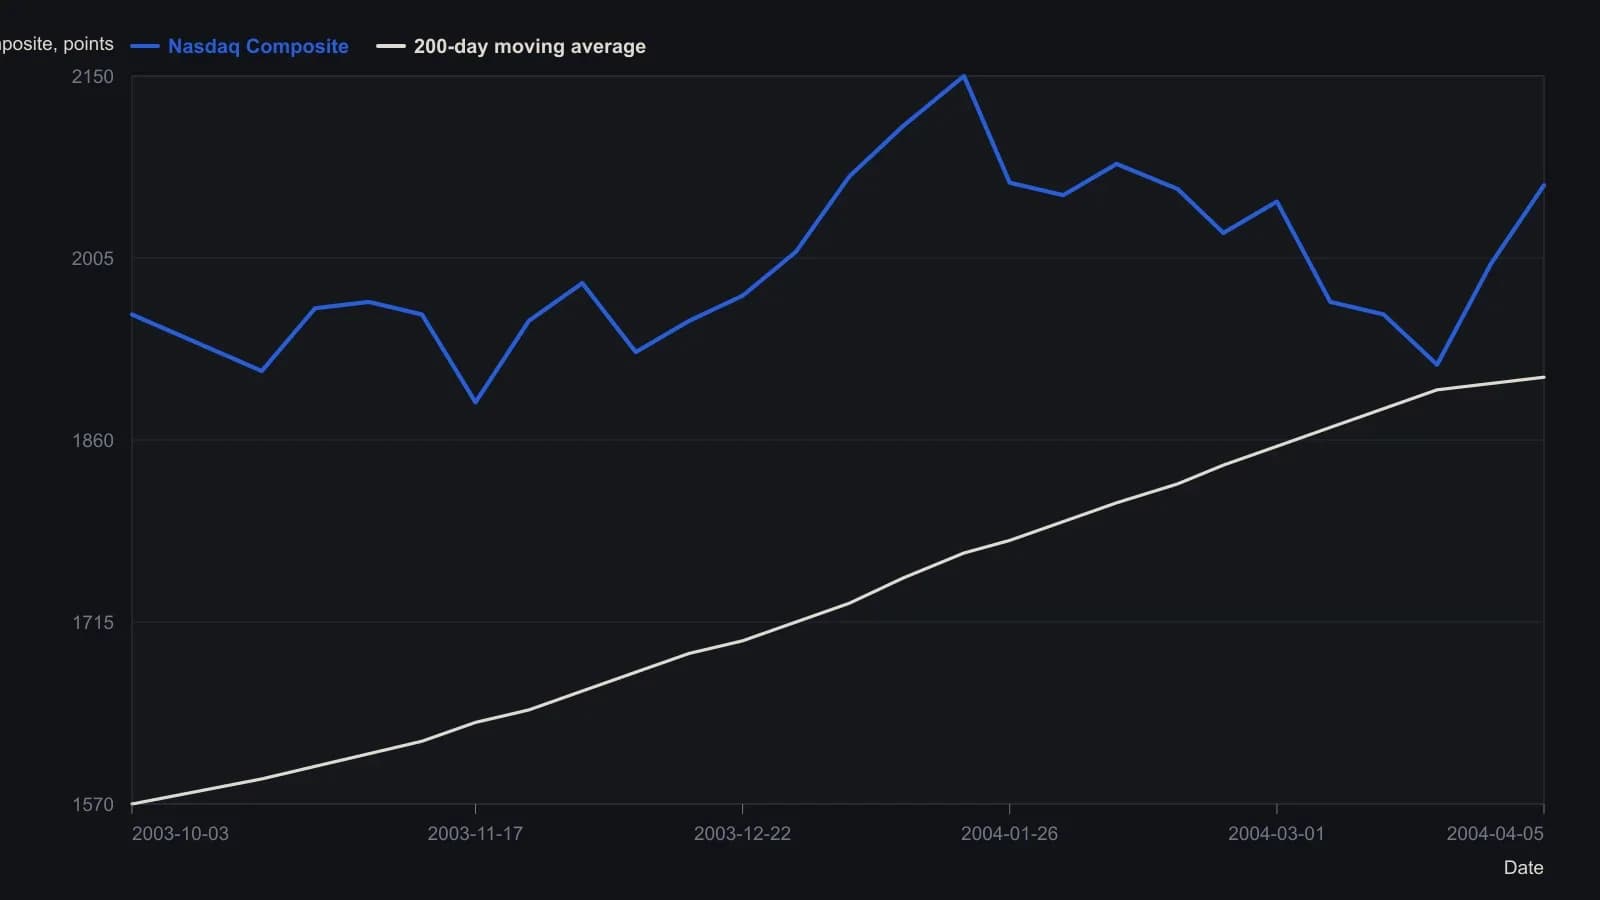
Daily candles sampled on the labeled weeks and rounded to five points. The final close uses the window quote 2062.80. The red overlay is the 200-day moving average as plotted, not a recomputed average.
All readings on this track · 51 readings
- 1984Half-cycle differencing for momentum signals
- 1987Relative strength evaluation under competing optimization criteria
- 1988Weekly MACD as a two-clock momentum confirmation stack
- 1989Equal-weight zero-cross from smoothed spreads
- 1989Testing relative-strength-index reversal rules against trend continuation
- 1989Smoothed three-day futures filter for index option bounces
- 1989Cycle-length windows for momentum, Relative Strength Index, and stochastic construction
- 1991Filtered rally magnitude as a bull-regime breakout
- 1992Constructing true strength from double-smoothed momentum
- 1992Constructing a double-smoothed true strength index
- 1993When momentum structure and breadth break together
- 1993Constructing double-smoothed range and momentum oscillators
- 1993Constructing a two-parameter relative momentum index
- 1993Building a bounded momentum oscillator with RSI smoothing
- 1993Two-speed oscillators with divergence and trendline gates
- 1993Constructing a relative momentum index from the relative strength index
- 1994Constructing daily advance-decline breadth tools
- 1994Building a composite regime score from monetary climate and weekly trend
- 1994Averaging Relative Strength Index and the stochastic oscillator into one reversal oscillator
- 1995Dividend-yield regression as a hold versus momentum gate
- 1996Jump and hold filters for long-term Treasury yield direction
- 1997Constructing extendedness from a 10 percent swing filter
- 1997A range-expansion oscillator that can refuse its own stretch
- 1997RSI trend permission and Fibonacci pullback rules
- 1998Nested midpoint construction for a range-normalized oscillator
- 1999Evaluating Relative Strength Index momentum with zero-line and threshold rules
- 1999Treat RSI and momentum as three mechanical procedures
- 2000Thrust strength figure from moving-average swings
- 2001Constructing a non-range-bound balance of market power score
- 2004Cleaned breadth oscillator and new-high divergence: a swing-market case file
- 2004Evaluating advance-issues-momentum on a fixed-symbol-basket
- 2004Constructing a trend filter from two adjacent high-low windows
- 2006A dollar-versus-commodity extreme as a regime case
- 2008Zero-centered stochastic bands and bracket stops
- 2012Evaluating engulfing momentum across hold windows
- 2012Staged stops as one mechanical entry and exit procedure
- 2012Stacking a relative-strength-index forecast, a trend filter, and long-only momentum
- 2013Constructing fair-value filters from averages and momentum
- 2014Constructing a multi-window slope divergence entry
- 2015Bandedge trend filter construction with inverse crossover rules
- 2017Opposite rules for index price and volatility momentum
- 2018A three-state overlay that colors a trend only after the line clears the bar
- 2018Half-cycle relative-strength index with a Fisher map for cyclic reversals
- 2018Emotion as a rule input when momentum breaks
- 2018Two-bar body expansion as a momentum breakout construction
- 2019Pair a two-day high breakout with a volume-weighted exit on the same chart
- 2020Building reflex and trendflex cross and extreme entry rules
- 2020Construct a dual-series price momentum oscillator overlay
- 2020A multi-timeframe stochastic as a panel of weekly voters
- 2020Centerline crossovers that compare index momentums
- 2020Multi-timeframe stochastic voting as one mechanical rule