1989issue C081-4
Testing relative-strength-index reversal rules against trend continuation
This archive article holds one relative-strength-index forecast fixed and compares a change-of-direction-rule, a back-through-rule with a trailing-stop, and an always-in-continuation-rule to ask which job the reading is being asked to do.
- The relative-strength-index is a bounded 0-to-100 oscillator built from averaged up versus down closing-price changes over a stated lookback, then recursively smoothed on each new bar.
- A divergence-setup is hard to encode as one unique historical test, while overbought-oversold thresholds are readily coded as counter-trend entries.
- The same forecast was compared as a change-of-direction-rule, a back-through-rule with an n-bar channel trailing-stop, and an always-in-continuation-rule momentum-strategy.
- The write-up concluded that an extreme reading more often marked further continuation than an imminent reversal.
How the forecast is built
The relative-strength-index is formed by averaging up closing-price net changes and down closing-price net changes over a lookback, taking their ratio, and mapping that ratio onto a scale that runs from 0 to 100.
A 14-bar first reading divides the up average and the down average each by 14. Later bars update each average by multiplying the prior average by 13, adding the latest up or down close, and dividing by 14.
A chart overlay, not a stay-in-the-market routine
The measure was presented as a chart overlay meant to mark recent highs and lows shortly after they form, not as a mechanical routine that stays continuously in the market.
What can be coded as a unique test
A discretionary divergence-setup waits for price to extend a prior extreme while the oscillator fails to confirm, then withholds action until the oscillator breaks the intervening swing. That sequence is hard to encode as a unique historical test.
Threshold use as an overbought-oversold reading is readily coded, and that coding typically places a counter-trend trade. An elevated zone is treated as a coming top and a depressed zone as a coming bottom.
Three procedures on the same reading
One tested short procedure used a change-of-direction-rule. It required the oscillator to trade above an elevated parameter illustrated at 70, then turn down for one bar, with entry on the next open and an n-bar high/low channel trailing-stop.
A second tested short procedure used a back-through-rule. It required the oscillator to first exceed that same elevated parameter and then recross it from above before selling on the next open, again with an n-bar high/low channel trailing-stop.
A third momentum-strategy used an always-in-continuation-rule. It bought when the oscillator reached an elevated reading and sold when it reached a depressed reading, remaining always in the market and using no stop.
The evaluation compared lookbacks of 9, 14, and 19 bars across the three procedures.
What the write-up concluded
The write-up concluded that an extreme oscillator reading more often marked further continuation than an imminent reversal, and that the oscillator therefore identified trends more consistently than overbought or oversold turning points.
Best-parameter RSI profits across twelve futures markets
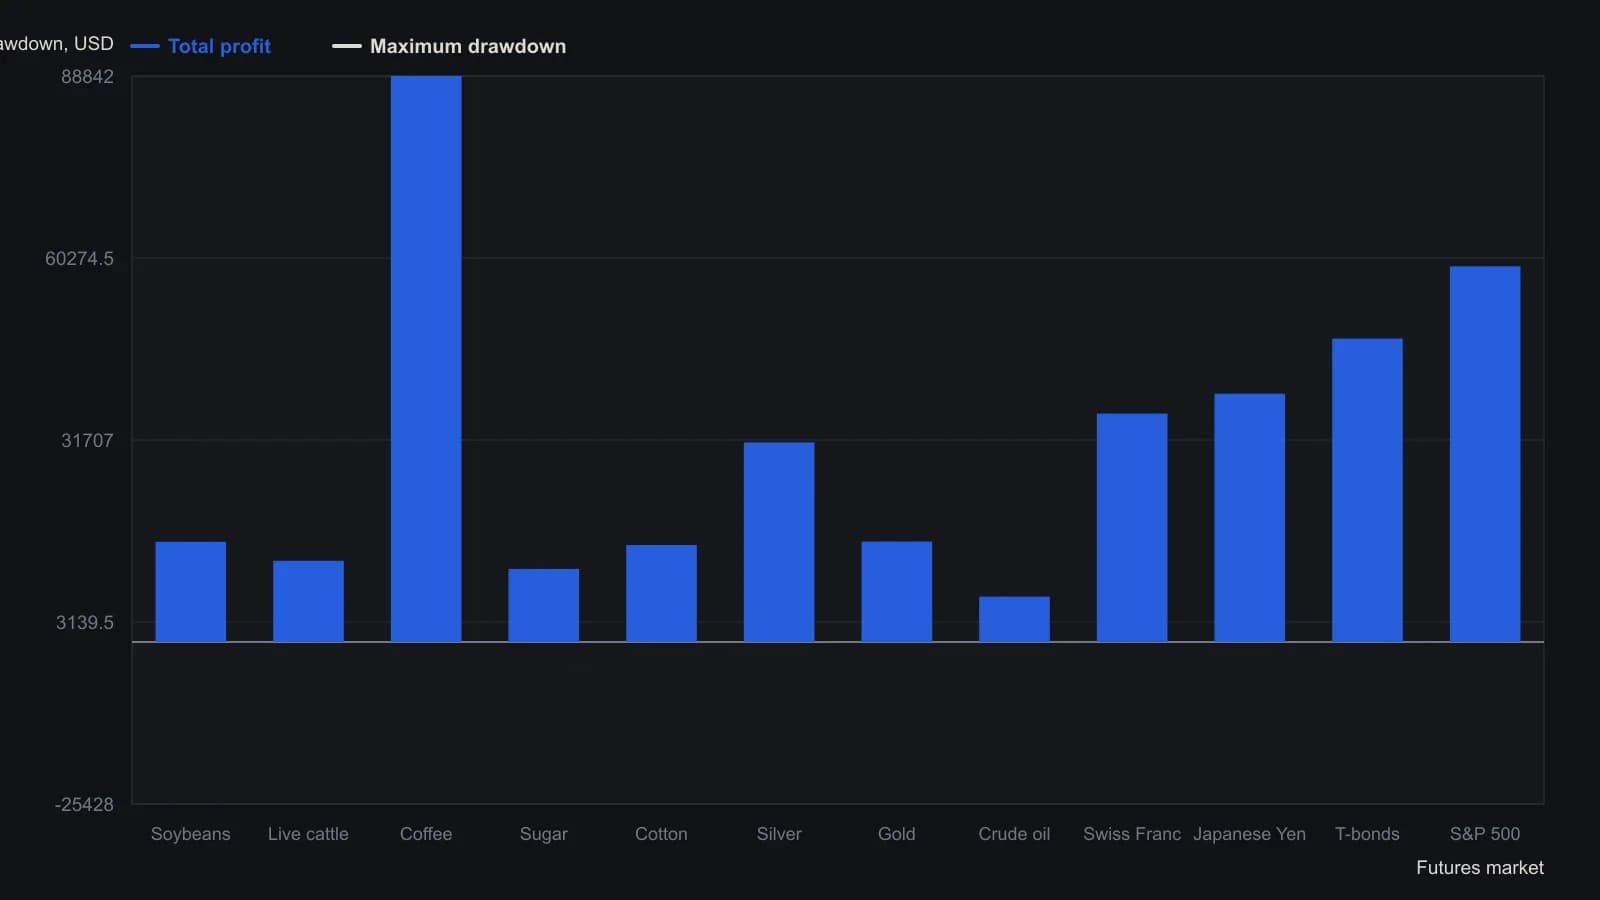
RSI length and overbought/oversold bands are the author's selected optimum for each market, not one shared parameter set. The S&P 500 is the only change-of-direction row (15-day high/low trailing stop); all other rows are buy-strength/sell-weakness with no stop.
All readings on this track · 51 readings
- 1984Half-cycle differencing for momentum signals
- 1987Relative strength evaluation under competing optimization criteria
- 1988Weekly MACD as a two-clock momentum confirmation stack
- 1989Equal-weight zero-cross from smoothed spreads
- 1989Testing relative-strength-index reversal rules against trend continuation
- 1989Smoothed three-day futures filter for index option bounces
- 1989Cycle-length windows for momentum, Relative Strength Index, and stochastic construction
- 1991Filtered rally magnitude as a bull-regime breakout
- 1992Constructing true strength from double-smoothed momentum
- 1992Constructing a double-smoothed true strength index
- 1993When momentum structure and breadth break together
- 1993Constructing double-smoothed range and momentum oscillators
- 1993Constructing a two-parameter relative momentum index
- 1993Building a bounded momentum oscillator with RSI smoothing
- 1993Two-speed oscillators with divergence and trendline gates
- 1993Constructing a relative momentum index from the relative strength index
- 1994Constructing daily advance-decline breadth tools
- 1994Building a composite regime score from monetary climate and weekly trend
- 1994Averaging Relative Strength Index and the stochastic oscillator into one reversal oscillator
- 1995Dividend-yield regression as a hold versus momentum gate
- 1996Jump and hold filters for long-term Treasury yield direction
- 1997Constructing extendedness from a 10 percent swing filter
- 1997A range-expansion oscillator that can refuse its own stretch
- 1997RSI trend permission and Fibonacci pullback rules
- 1998Nested midpoint construction for a range-normalized oscillator
- 1999Evaluating Relative Strength Index momentum with zero-line and threshold rules
- 1999Treat RSI and momentum as three mechanical procedures
- 2000Thrust strength figure from moving-average swings
- 2001Constructing a non-range-bound balance of market power score
- 2004Cleaned breadth oscillator and new-high divergence: a swing-market case file
- 2004Evaluating advance-issues-momentum on a fixed-symbol-basket
- 2004Constructing a trend filter from two adjacent high-low windows
- 2006A dollar-versus-commodity extreme as a regime case
- 2008Zero-centered stochastic bands and bracket stops
- 2012Evaluating engulfing momentum across hold windows
- 2012Staged stops as one mechanical entry and exit procedure
- 2012Stacking a relative-strength-index forecast, a trend filter, and long-only momentum
- 2013Constructing fair-value filters from averages and momentum
- 2014Constructing a multi-window slope divergence entry
- 2015Bandedge trend filter construction with inverse crossover rules
- 2017Opposite rules for index price and volatility momentum
- 2018A three-state overlay that colors a trend only after the line clears the bar
- 2018Half-cycle relative-strength index with a Fisher map for cyclic reversals
- 2018Emotion as a rule input when momentum breaks
- 2018Two-bar body expansion as a momentum breakout construction
- 2019Pair a two-day high breakout with a volume-weighted exit on the same chart
- 2020Building reflex and trendflex cross and extreme entry rules
- 2020Construct a dual-series price momentum oscillator overlay
- 2020A multi-timeframe stochastic as a panel of weekly voters
- 2020Centerline crossovers that compare index momentums
- 2020Multi-timeframe stochastic voting as one mechanical rule