2020issue C0842-45
A multi-timeframe stochastic as a panel of weekly voters
A 21-period stochastic can be computed on seven bar lengths and aligned to one weekly calendar. Buying pressure and selling pressure then become integer vote summaries, so agreement, disagreement, and quiet periods can be written as explicit rules.
- A 21-period stochastic can be computed on daily, weekly, bimonthly, quarter-quarterly, monthly, half-quarterly, and quarterly bars and shown together on one daily chart.
- Slower series populate forward onto weekly dates, and the daily series enters the weekly vote as a five-day high or low rather than as its raw reading. Each weekly vote summary is then an integer from 0 to 7.
- Buying pressure is the count of timeframe readings below 0.2. Selling pressure is the count of readings above 0.8. Agreement across several timeframes is less frequent, and therefore more informative, than the same reading on one timeframe.
- A fully specified long rule can buy at a maximum-to-date buying pressure with selling pressure at 0, or use a high-agreement setup and a later trigger. Very low readings on both pressure series are a consolidation or pause, not a directional vote.
A familiar oscillator as a panel of voters
Editorial interpretation: treat the stochastic oscillator as a panel of independent voters rather than as a single overbought-oversold line. Agreement, disagreement, and quiet periods then become explicit states a rule can test, instead of impressions taken from a chart.
The archive workflow computes a 21-period stochastic on daily, weekly, bimonthly, quarter-quarterly, monthly, half-quarterly, and quarterly bars and shows those series together on one daily chart.
How each timeframe votes on the same week
Slower timeframe series are aligned to weekly dates by populating forward each series' latest value until that timeframe updates. Every voter can then be read on the same calendar.
The daily series is represented in the weekly vote by a five-day high or low of that oscillator rather than by its raw daily reading. That daily stabilizer replaces the raw daily oscillator with a short high or low of that series so the fastest voter does not dominate the weekly tally.
With seven timeframes, each weekly vote summary is an integer from 0 to 7.
Buying pressure, selling pressure, and long rules
Buying pressure is the count of timeframe readings below 0.2 on a given weekly date. Selling pressure is the count of readings above 0.8. Each count is a vote summary that condenses overbought or oversold states into one plottable series.
One fully specified long rule buys when buying pressure is at its maximum to date and selling pressure is 0. It exits when selling pressure is at its maximum to date and buying pressure is 0.
Two other long procedures share a setup of buying pressure at least 6 with selling pressure 0. They then differ on the trigger: selling pressure rising above 0, or buying pressure declining. Both of those setup-and-trigger procedures exit on the same condition used in the first example, selling pressure at its maximum to date with buying pressure at 0.
Halliburton closes with three vote-defined buy troughs
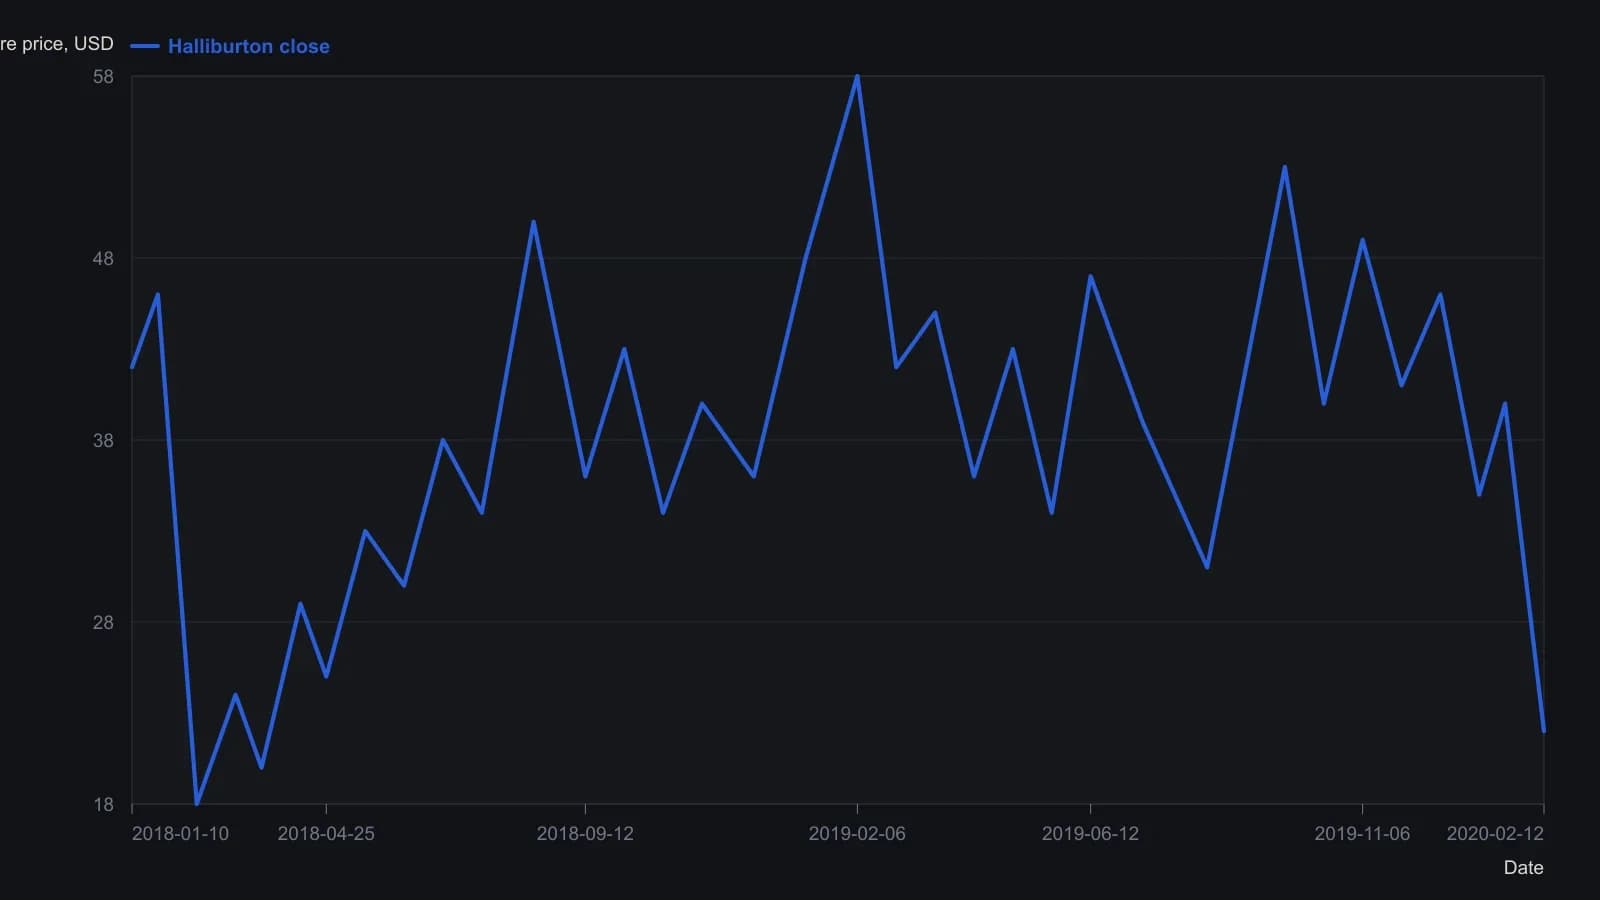
The 21-period %K votes on daily, weekly, bimonthly, quarter-quarterly, monthly, half-quarterly, and quarterly bars aligned to a weekly calendar. Oversold is below 0.2; overbought is above 0.8. The daily series uses a five-day high or low before it votes. Dates are aligned to the printed two-month ticks.
When both pressure series stay quiet
Very low readings on both pressure series are treated as a consolidation or pause rather than as a directional vote. Editorial interpretation: the all-quiet state is neither a weak long nor a weak short. It is a third, testable outcome in which the panel is not casting a directional vote.
All readings on this track · 51 readings
- 1984Half-cycle differencing for momentum signals
- 1987Relative strength evaluation under competing optimization criteria
- 1988Weekly MACD as a two-clock momentum confirmation stack
- 1989Equal-weight zero-cross from smoothed spreads
- 1989Testing relative-strength-index reversal rules against trend continuation
- 1989Smoothed three-day futures filter for index option bounces
- 1989Cycle-length windows for momentum, Relative Strength Index, and stochastic construction
- 1991Filtered rally magnitude as a bull-regime breakout
- 1992Constructing true strength from double-smoothed momentum
- 1992Constructing a double-smoothed true strength index
- 1993When momentum structure and breadth break together
- 1993Constructing double-smoothed range and momentum oscillators
- 1993Constructing a two-parameter relative momentum index
- 1993Building a bounded momentum oscillator with RSI smoothing
- 1993Two-speed oscillators with divergence and trendline gates
- 1993Constructing a relative momentum index from the relative strength index
- 1994Constructing daily advance-decline breadth tools
- 1994Building a composite regime score from monetary climate and weekly trend
- 1994Averaging Relative Strength Index and the stochastic oscillator into one reversal oscillator
- 1995Dividend-yield regression as a hold versus momentum gate
- 1996Jump and hold filters for long-term Treasury yield direction
- 1997Constructing extendedness from a 10 percent swing filter
- 1997A range-expansion oscillator that can refuse its own stretch
- 1997RSI trend permission and Fibonacci pullback rules
- 1998Nested midpoint construction for a range-normalized oscillator
- 1999Evaluating Relative Strength Index momentum with zero-line and threshold rules
- 1999Treat RSI and momentum as three mechanical procedures
- 2000Thrust strength figure from moving-average swings
- 2001Constructing a non-range-bound balance of market power score
- 2004Cleaned breadth oscillator and new-high divergence: a swing-market case file
- 2004Evaluating advance-issues-momentum on a fixed-symbol-basket
- 2004Constructing a trend filter from two adjacent high-low windows
- 2006A dollar-versus-commodity extreme as a regime case
- 2008Zero-centered stochastic bands and bracket stops
- 2012Evaluating engulfing momentum across hold windows
- 2012Staged stops as one mechanical entry and exit procedure
- 2012Stacking a relative-strength-index forecast, a trend filter, and long-only momentum
- 2013Constructing fair-value filters from averages and momentum
- 2014Constructing a multi-window slope divergence entry
- 2015Bandedge trend filter construction with inverse crossover rules
- 2017Opposite rules for index price and volatility momentum
- 2018A three-state overlay that colors a trend only after the line clears the bar
- 2018Half-cycle relative-strength index with a Fisher map for cyclic reversals
- 2018Emotion as a rule input when momentum breaks
- 2018Two-bar body expansion as a momentum breakout construction
- 2019Pair a two-day high breakout with a volume-weighted exit on the same chart
- 2020Building reflex and trendflex cross and extreme entry rules
- 2020Construct a dual-series price momentum oscillator overlay
- 2020A multi-timeframe stochastic as a panel of weekly voters
- 2020Centerline crossovers that compare index momentums
- 2020Multi-timeframe stochastic voting as one mechanical rule