1999issue C071-5
Evaluating Relative Strength Index momentum with zero-line and threshold rules
A historical source frames momentum as a difference-over-time oscillator, states three evaluation rules, and compares two Relative Strength Index procedures on the same Compaq sample: a stop-and-reverse method and a method that can go flat.
- Momentum is framed as a difference-over-time construction that can be plotted as an overbought-oversold oscillator beneath price.
- Three evaluation rules are stated: sign versus the zero line, extremes for overbought or oversold conditions, and whether momentum values are rising or falling.
- Two Relative Strength Index procedures were evaluated on Compaq: a stop-and-reverse method and a method that can go flat.
- The source concludes that extreme momentum values can precede reversal, while a switch across the equilibrium line is usually read as evidence that a reversal has already occurred.
Why momentum is studied
The source frames momentum as a difference-over-time construction that can be plotted as an overbought-oversold oscillator beneath price. Trend-following is presented as late on initial moves and prone to whipsaw when prices remain in ranges, which is the stated reason for studying momentum.
A difference-over-time series
A 10-day momentum series for Intel is defined as the latest close minus the close 10 sessions earlier. A momentum strategy treats rising or falling price velocity as the basis for holding, reversing, or standing aside.
The pendulum analogy maps zero momentum to the swing extremes and maximum-magnitude momentum to the midpoint, then maps those states onto range extremes and trend reversal points.
Three rules for reading the series
Three explicit evaluation rules are stated: sign versus the zero line for trend direction, extremes for overbought or oversold conditions, and whether momentum values are rising or falling. An overbought-oversold band is a pair of fixed high and low oscillator levels used as candidate reversal or exit zones.
A zero-line crossing is a signal generated when the oscillator moves from one side of equilibrium to the other. A crossing from below is treated as a buy signal and a crossing from above as a sell signal, analogous to the pendulum reversing at its extremes. Those triggers are rule-based entries: explicit buy, sell, or flatten rules defined by oscillator crossings or threshold bands.
Two Relative Strength Index procedures
The Relative Strength Index is a bounded oscillator of recent up versus down closes used here as the forecast series for rule tests. Two procedures were evaluated historically on Compaq: a stop-and-reverse method and a method that can go flat using both a 50 line and 75/30 entry-exit criteria.
Stop-and-reverse is a posture that stays in the market by flipping from long to short, or short to long, when the opposite rule fires. Going-flat is a posture that exits to cash and waits for the next qualifying entry instead of reversing immediately.
What the historical comparison recorded
In the method-2 historical summary, commissions and slippage were omitted. The tabulated record shows 71 trades, 23 winners, 32.39 percent profitable, net 28.88, and an average win/loss ratio of 3.53.
Both tested methods were described as having about 32 percent winning trades, remaining net-profitable, and showing average win/loss ratios above 3.0 over the illustrated Compaq sample.
The conclusion states that extreme momentum values can precede reversal and that a switch across the equilibrium line is usually read as evidence that a reversal has already occurred.
Intel 10-day momentum versus the zero line, January–March 1999
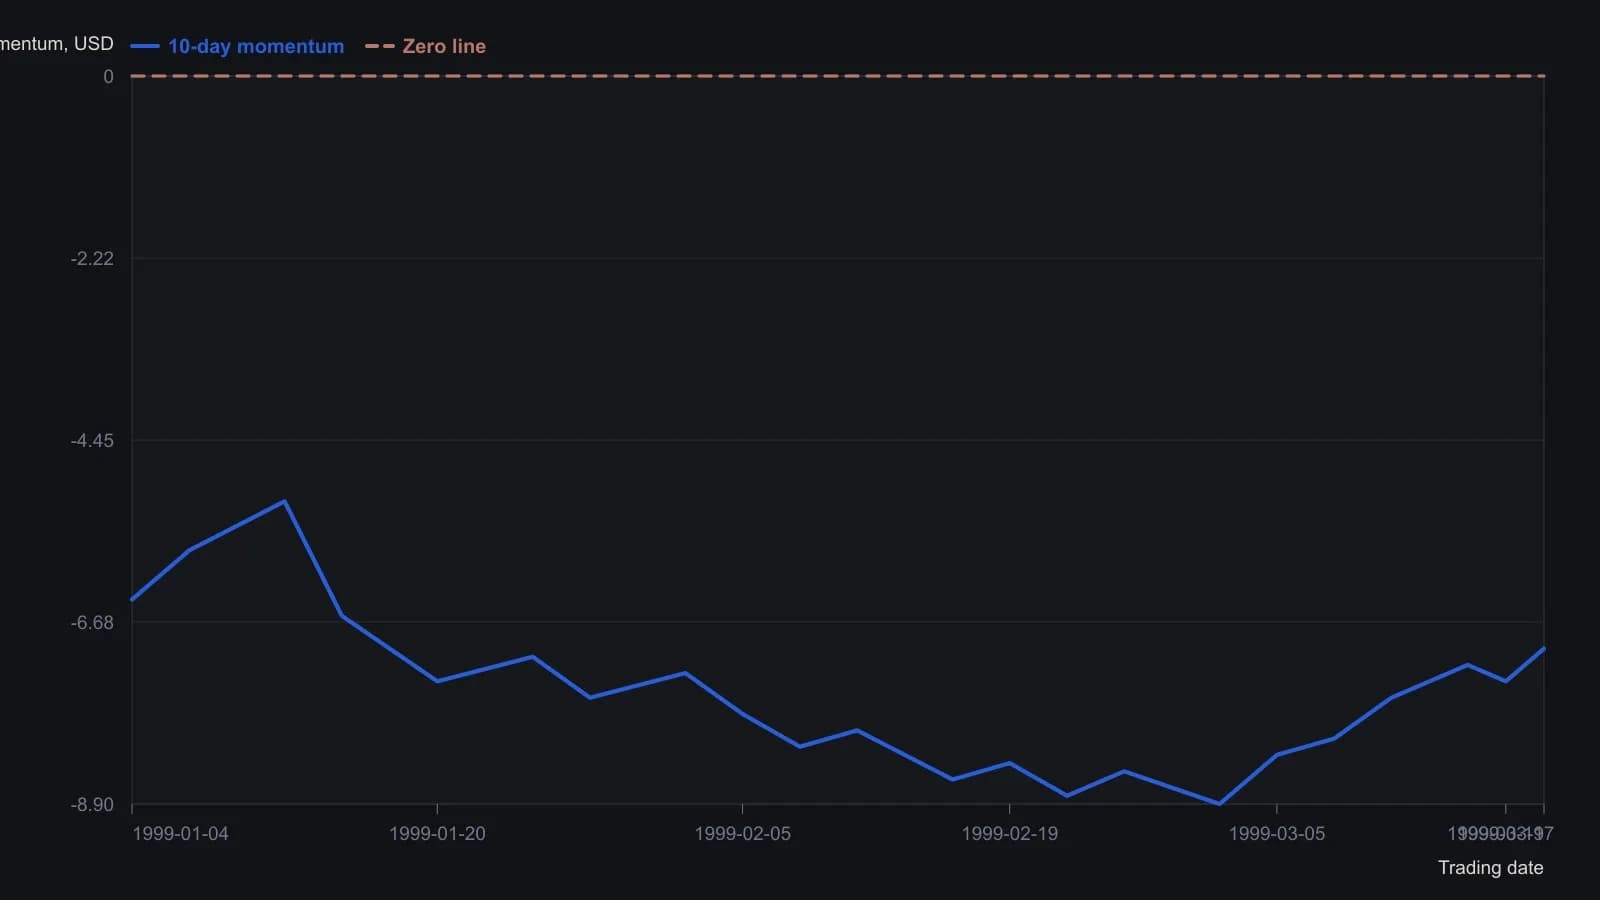
Momentum is the 10-session close-to-close difference shown on the source chart. Price closes are included only as a reference path. Neither series is a published table, so points are spaced about every two to three trading days and rounded to the resolution the screenshot will support.
All readings on this track · 51 readings
- 1984Half-cycle differencing for momentum signals
- 1987Relative strength evaluation under competing optimization criteria
- 1988Weekly MACD as a two-clock momentum confirmation stack
- 1989Equal-weight zero-cross from smoothed spreads
- 1989Testing relative-strength-index reversal rules against trend continuation
- 1989Smoothed three-day futures filter for index option bounces
- 1989Cycle-length windows for momentum, Relative Strength Index, and stochastic construction
- 1991Filtered rally magnitude as a bull-regime breakout
- 1992Constructing true strength from double-smoothed momentum
- 1992Constructing a double-smoothed true strength index
- 1993When momentum structure and breadth break together
- 1993Constructing double-smoothed range and momentum oscillators
- 1993Constructing a two-parameter relative momentum index
- 1993Building a bounded momentum oscillator with RSI smoothing
- 1993Two-speed oscillators with divergence and trendline gates
- 1993Constructing a relative momentum index from the relative strength index
- 1994Constructing daily advance-decline breadth tools
- 1994Building a composite regime score from monetary climate and weekly trend
- 1994Averaging Relative Strength Index and the stochastic oscillator into one reversal oscillator
- 1995Dividend-yield regression as a hold versus momentum gate
- 1996Jump and hold filters for long-term Treasury yield direction
- 1997Constructing extendedness from a 10 percent swing filter
- 1997A range-expansion oscillator that can refuse its own stretch
- 1997RSI trend permission and Fibonacci pullback rules
- 1998Nested midpoint construction for a range-normalized oscillator
- 1999Evaluating Relative Strength Index momentum with zero-line and threshold rules
- 1999Treat RSI and momentum as three mechanical procedures
- 2000Thrust strength figure from moving-average swings
- 2001Constructing a non-range-bound balance of market power score
- 2004Cleaned breadth oscillator and new-high divergence: a swing-market case file
- 2004Evaluating advance-issues-momentum on a fixed-symbol-basket
- 2004Constructing a trend filter from two adjacent high-low windows
- 2006A dollar-versus-commodity extreme as a regime case
- 2008Zero-centered stochastic bands and bracket stops
- 2012Evaluating engulfing momentum across hold windows
- 2012Staged stops as one mechanical entry and exit procedure
- 2012Stacking a relative-strength-index forecast, a trend filter, and long-only momentum
- 2013Constructing fair-value filters from averages and momentum
- 2014Constructing a multi-window slope divergence entry
- 2015Bandedge trend filter construction with inverse crossover rules
- 2017Opposite rules for index price and volatility momentum
- 2018A three-state overlay that colors a trend only after the line clears the bar
- 2018Half-cycle relative-strength index with a Fisher map for cyclic reversals
- 2018Emotion as a rule input when momentum breaks
- 2018Two-bar body expansion as a momentum breakout construction
- 2019Pair a two-day high breakout with a volume-weighted exit on the same chart
- 2020Building reflex and trendflex cross and extreme entry rules
- 2020Construct a dual-series price momentum oscillator overlay
- 2020A multi-timeframe stochastic as a panel of weekly voters
- 2020Centerline crossovers that compare index momentums
- 2020Multi-timeframe stochastic voting as one mechanical rule