1995issue C081-5
Dividend-yield regression as a hold versus momentum gate
The archive used a quadratic-yield-regression as a buy-and-hold-meter from starting-dividend-yield to decade-ahead-return. Editorial reading: treat that meter as an evaluation gate for when a passive hold had historical support, and treat an intermediate-momentum-overlay as the complementary testable procedure when starting yields were low.
- A monthly starting-dividend-yield series was aligned with the decade-ahead-return realized on the same broad index.
- The quadratic-yield-regression was the buy-and-hold-meter used to judge whether an unconditional hold had historical statistical support.
- A low-yield-correction-mark and a high-yield-accumulation-mark sat at opposite ends of that meter.
- When starting yields were low, the procedure used an intermediate-momentum-overlay instead of an unconditional long hold.
What the archive aligned
A monthly series of broad-index dividend yields was aligned with the compound annual total return realized on the same index over the following ten years. That pairing is the buy-and-hold-meter: a historical mapping from the starting-dividend-yield, the trailing distribution rate observed on the index at the beginning of a forecast window, to the decade-ahead-return, the compound annual total return, including distributions, over the ten years that follow a yield observation.
How the regression was specified
The evaluation specified a quadratic-yield-regression with the decade-ahead-return as the dependent variable and the contemporaneous starting-dividend-yield as the explanatory input. The specification used yield and a squared yield term so the fitted path from starting yield to decade-ahead-return could bend. The fitted specification was reported with an adjusted R-squared of 0.83, a residual standard error of 1.80, and an F-statistic on 2 and 443 degrees of freedom.
S&P 500 10-year return versus starting dividend yield
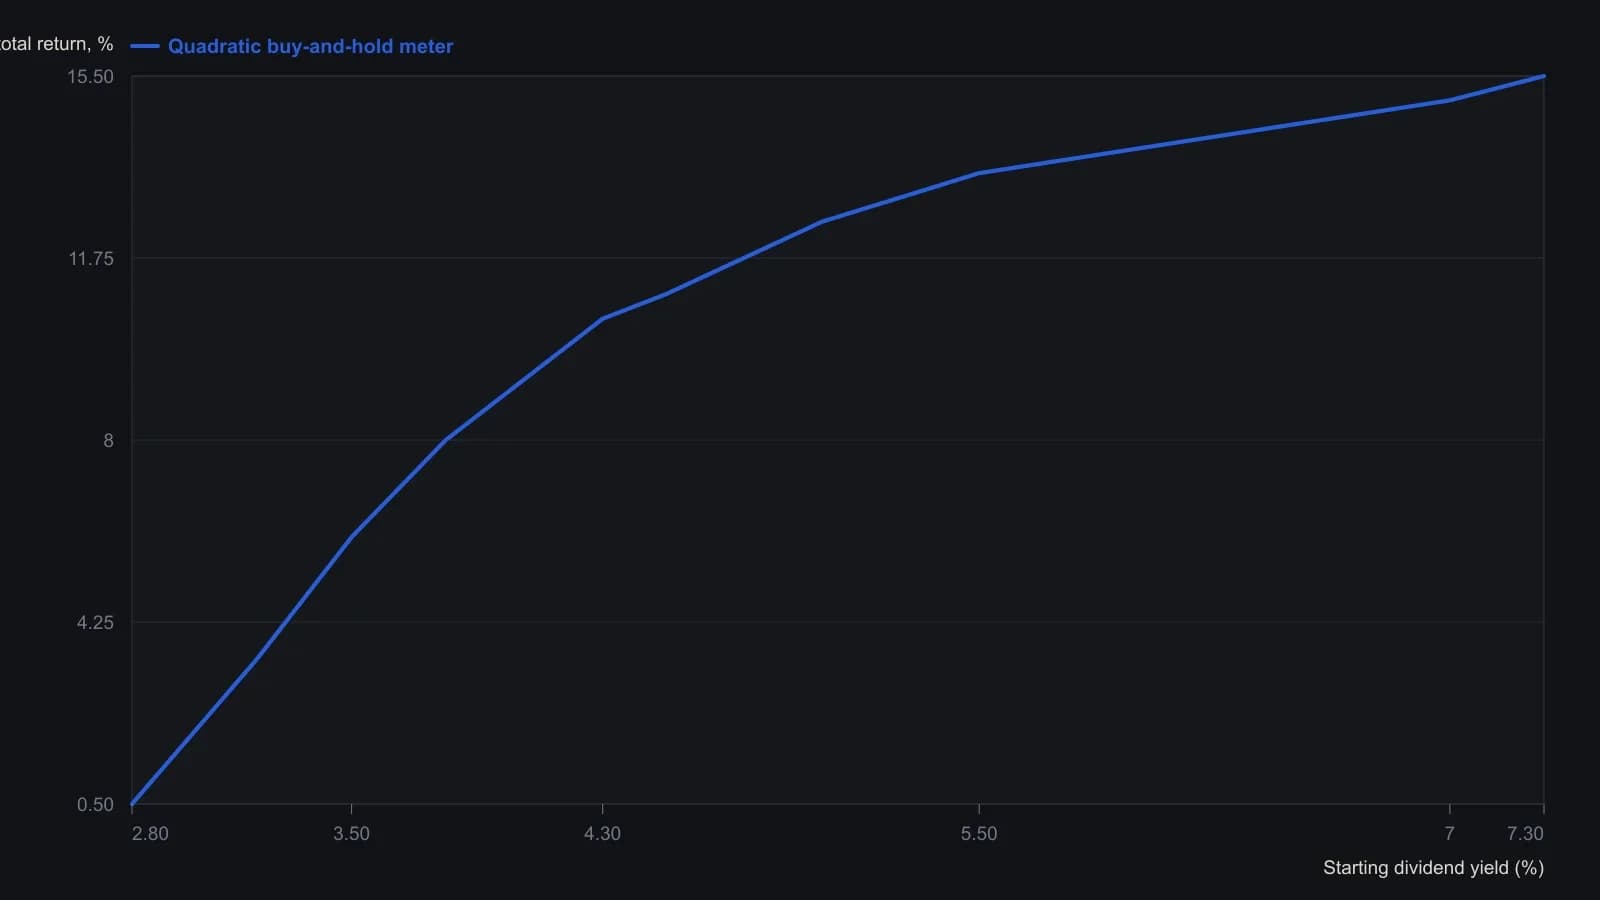
Quadratic fit of 10-year compound annual total return on monthly S&P 500 dividend yield; last starting month in the fit is February 1985. Curve values are read from the published plot, not from printed coefficients. Adjusted R-squared was 0.83.
How the postwar sample was closed
The postwar sample was constructed so that the final complete ten-year return window began around March 1985 and used the February 1985 yield as its starting observation.
Yield marks and the complementary overlay
Historical charts treated an index yield below 3 percent as a low-yield-correction-mark, a condition often followed, after a short interval, by a sharp index decline. A yield above 6 percent was treated as a high-yield-accumulation-mark, a historically noted condition in which a very high index yield coincided with cycle lows and was treated as a traditional practitioner entry cue.
When starting yields were low, the proposed procedure replaced an unconditional long hold with an intermediate-momentum-overlay, a rule that permits equity exposure only when an intermediate-horizon momentum confirmation is present. A mid-1960s starting yield near 3 percent was used as the analog for a later decade of repeated advances and declines rather than a smooth passive hold.
All readings on this track · 51 readings
- 1984Half-cycle differencing for momentum signals
- 1987Relative strength evaluation under competing optimization criteria
- 1988Weekly MACD as a two-clock momentum confirmation stack
- 1989Equal-weight zero-cross from smoothed spreads
- 1989Testing relative-strength-index reversal rules against trend continuation
- 1989Smoothed three-day futures filter for index option bounces
- 1989Cycle-length windows for momentum, Relative Strength Index, and stochastic construction
- 1991Filtered rally magnitude as a bull-regime breakout
- 1992Constructing true strength from double-smoothed momentum
- 1992Constructing a double-smoothed true strength index
- 1993When momentum structure and breadth break together
- 1993Constructing double-smoothed range and momentum oscillators
- 1993Constructing a two-parameter relative momentum index
- 1993Building a bounded momentum oscillator with RSI smoothing
- 1993Two-speed oscillators with divergence and trendline gates
- 1993Constructing a relative momentum index from the relative strength index
- 1994Constructing daily advance-decline breadth tools
- 1994Building a composite regime score from monetary climate and weekly trend
- 1994Averaging Relative Strength Index and the stochastic oscillator into one reversal oscillator
- 1995Dividend-yield regression as a hold versus momentum gate
- 1996Jump and hold filters for long-term Treasury yield direction
- 1997Constructing extendedness from a 10 percent swing filter
- 1997A range-expansion oscillator that can refuse its own stretch
- 1997RSI trend permission and Fibonacci pullback rules
- 1998Nested midpoint construction for a range-normalized oscillator
- 1999Evaluating Relative Strength Index momentum with zero-line and threshold rules
- 1999Treat RSI and momentum as three mechanical procedures
- 2000Thrust strength figure from moving-average swings
- 2001Constructing a non-range-bound balance of market power score
- 2004Cleaned breadth oscillator and new-high divergence: a swing-market case file
- 2004Evaluating advance-issues-momentum on a fixed-symbol-basket
- 2004Constructing a trend filter from two adjacent high-low windows
- 2006A dollar-versus-commodity extreme as a regime case
- 2008Zero-centered stochastic bands and bracket stops
- 2012Evaluating engulfing momentum across hold windows
- 2012Staged stops as one mechanical entry and exit procedure
- 2012Stacking a relative-strength-index forecast, a trend filter, and long-only momentum
- 2013Constructing fair-value filters from averages and momentum
- 2014Constructing a multi-window slope divergence entry
- 2015Bandedge trend filter construction with inverse crossover rules
- 2017Opposite rules for index price and volatility momentum
- 2018A three-state overlay that colors a trend only after the line clears the bar
- 2018Half-cycle relative-strength index with a Fisher map for cyclic reversals
- 2018Emotion as a rule input when momentum breaks
- 2018Two-bar body expansion as a momentum breakout construction
- 2019Pair a two-day high breakout with a volume-weighted exit on the same chart
- 2020Building reflex and trendflex cross and extreme entry rules
- 2020Construct a dual-series price momentum oscillator overlay
- 2020A multi-timeframe stochastic as a panel of weekly voters
- 2020Centerline crossovers that compare index momentums
- 2020Multi-timeframe stochastic voting as one mechanical rule