1996issue C041-8
Jump and hold filters for long-term Treasury yield direction
A mechanical procedure reads a gold-mining index through a short-lag percentage jump and a multi-week hold above or below an in-position extreme, then scores the locked rules on a second yield sample. The same flags invert from yield to bond and become a cash exit when they are overlaid on a fund that cannot be shorted.
- The procedure treats a gold-mining index as a directional gauge for long-term yields because published inflation prints describe the past, while gold is used as a store-of-value proxy for perceived future inflation.
- GMIjmp% is a one-to-four-week percentage jump that marks a sudden change in inflation perception, and AbvBlw requires a set number of weeks above the in-short low or below the in-long high before a buy or sell.
- Five parameters are chosen jointly on a parameter-search-segment for net result, win rate, drawdown and nearby-value stability, then locked before any run on an out-of-sample-segment.
- Buying the 30-year Treasury yield series is defined as selling the bond, and a government-securities fund overlay can treat the short side only as a cash exit.
A gold-mining index as a directional gauge
The procedure treats a gold-mining index as a directional gauge for long-term yields because published inflation prints describe the past, while gold is used as a store-of-value proxy for perceived future inflation.
Among several commodity and mining series tested as predictors of long-term rate direction, the gold-mining index was selected on empirical grounds. A shorter gold-and-silver exchange index was described as similar but too short to treat as valid.
A short-lag jump and a multi-week hold
The first filter is GMIjmp%, the percentage change in the gold-mining index over a short lag of one to four weeks. It is intended to mark a sudden change in inflation perception. Here that short-interval percentage jump is treated as a discrete, lagged rate-of-change baseline rather than a smoothed average of prices.
A moving-average in this procedure is therefore a defined-lookback transform of ordered observations. The momentum-strategy rule treats a large, rapid change in the gold-mining proxy as a shift in inflation perception and therefore as a directional cue for long-term yields.
The second filter is AbvBlw. The state turns positive after the proxy stays above the lowest low recorded while short for a set number of weeks, and it turns negative after the proxy stays below the highest high recorded while long for a set number of weeks. The mechanical-trading-system buys after the above-low hold and sells after the below-high hold.
Together the jump thresholds and the multi-week persistence tests fully specify entry, exit and abstention. The mechanical-trading-system is applied without discretionary override.
Choosing five parameters on one sample only
Five parameters are chosen jointly: the up-jump threshold, the down-jump threshold, the jump lag, the weeks above the short-side low, and the weeks below the long-side high. They are judged together for net result, win rate, drawdown and nearby-value stability, after first reducing the search space rather than scanning all five blindly.
Development is required to use at least two separate data segments. The parameter-search-segment is the historical window used to choose jump percentages, lag length and persistence weeks. The out-of-sample-segment is a separate historical window used only after parameters are locked, to test whether the same rules still produce a usable directional result. That later window is not used to pick the rules.
Locked values on two weekly yield windows
On weekly 30-year yields from June 1985 through December 1995, locked values of a 24 percent up jump, a minus 20 percent down jump, a four-week lag and 50-week persistence on both sides produced eight trades, of which seven were profitable. Those locked values belong to that window.
The same locked parameters applied to weekly 30-year yields from January 1975 through January 1986 produced six trades, of which five were profitable.
Weekly 30-year Treasury yields, mid-1990 through 1995
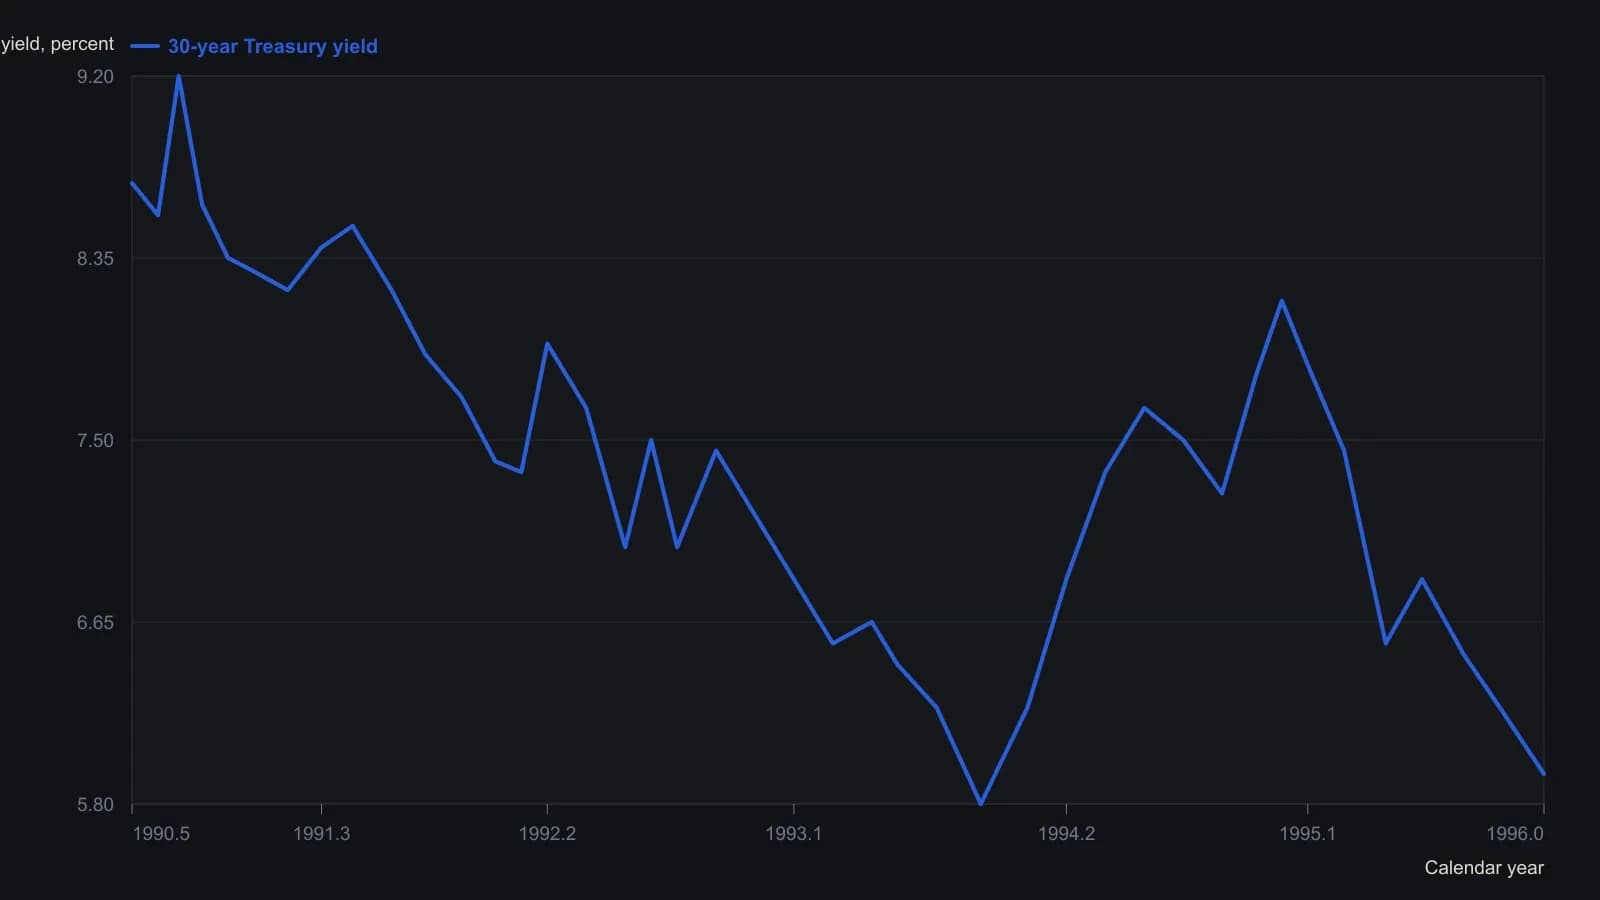
Weekly closes were digitized from the published raster, so turning points are approximate to about five basis points. The 29 December 1995 close of 5.94 percent is the printed header value, not a pixel interpolation. Numbered signal arrows on the source pane are omitted.
The same signals on a fund that cannot be shorted
When the same signals were overlaid on a government-securities fund from September 1982 through December 1995, short-side results were treated as a cash-exit teaching case because the fund cannot be shorted.
The author notes that the fund window is only a few years longer than the yield test, so the overlay can inherit curve-fitting from the yield series.
All readings on this track · 51 readings
- 1984Half-cycle differencing for momentum signals
- 1987Relative strength evaluation under competing optimization criteria
- 1988Weekly MACD as a two-clock momentum confirmation stack
- 1989Equal-weight zero-cross from smoothed spreads
- 1989Testing relative-strength-index reversal rules against trend continuation
- 1989Smoothed three-day futures filter for index option bounces
- 1989Cycle-length windows for momentum, Relative Strength Index, and stochastic construction
- 1991Filtered rally magnitude as a bull-regime breakout
- 1992Constructing true strength from double-smoothed momentum
- 1992Constructing a double-smoothed true strength index
- 1993When momentum structure and breadth break together
- 1993Constructing double-smoothed range and momentum oscillators
- 1993Constructing a two-parameter relative momentum index
- 1993Building a bounded momentum oscillator with RSI smoothing
- 1993Two-speed oscillators with divergence and trendline gates
- 1993Constructing a relative momentum index from the relative strength index
- 1994Constructing daily advance-decline breadth tools
- 1994Building a composite regime score from monetary climate and weekly trend
- 1994Averaging Relative Strength Index and the stochastic oscillator into one reversal oscillator
- 1995Dividend-yield regression as a hold versus momentum gate
- 1996Jump and hold filters for long-term Treasury yield direction
- 1997Constructing extendedness from a 10 percent swing filter
- 1997A range-expansion oscillator that can refuse its own stretch
- 1997RSI trend permission and Fibonacci pullback rules
- 1998Nested midpoint construction for a range-normalized oscillator
- 1999Evaluating Relative Strength Index momentum with zero-line and threshold rules
- 1999Treat RSI and momentum as three mechanical procedures
- 2000Thrust strength figure from moving-average swings
- 2001Constructing a non-range-bound balance of market power score
- 2004Cleaned breadth oscillator and new-high divergence: a swing-market case file
- 2004Evaluating advance-issues-momentum on a fixed-symbol-basket
- 2004Constructing a trend filter from two adjacent high-low windows
- 2006A dollar-versus-commodity extreme as a regime case
- 2008Zero-centered stochastic bands and bracket stops
- 2012Evaluating engulfing momentum across hold windows
- 2012Staged stops as one mechanical entry and exit procedure
- 2012Stacking a relative-strength-index forecast, a trend filter, and long-only momentum
- 2013Constructing fair-value filters from averages and momentum
- 2014Constructing a multi-window slope divergence entry
- 2015Bandedge trend filter construction with inverse crossover rules
- 2017Opposite rules for index price and volatility momentum
- 2018A three-state overlay that colors a trend only after the line clears the bar
- 2018Half-cycle relative-strength index with a Fisher map for cyclic reversals
- 2018Emotion as a rule input when momentum breaks
- 2018Two-bar body expansion as a momentum breakout construction
- 2019Pair a two-day high breakout with a volume-weighted exit on the same chart
- 2020Building reflex and trendflex cross and extreme entry rules
- 2020Construct a dual-series price momentum oscillator overlay
- 2020A multi-timeframe stochastic as a panel of weekly voters
- 2020Centerline crossovers that compare index momentums
- 2020Multi-timeframe stochastic voting as one mechanical rule