2004issue C081-5
Evaluating advance-issues-momentum on a fixed-symbol-basket
Broad-market-advancing-issues are treated as a whole-market breadth reading, yet they are unbounded and their membership can change. Advance-issues-momentum replaces that open tape with a range-capped headcount on a fixed-symbol-basket, so turning-point-confirmation can be written as one mirrored long and short procedure and checked as a mechanical-bias-test.
- Broad-market-advancing-issues have no fixed membership and no upper bound, which the write-up flags as especially awkward for systematic end-of-day use.
- Advance-issues-momentum is the daily headcount of names in a fixed-symbol-basket whose n-day-momentum is positive, so overbought and oversold zones can be stated as stable thresholds.
- The worked example counted the 30 industrial-average constituents on a 20-day lookback and plotted that reading against a related large-cap index future that was excluded from the tally.
- The long and short turning-point-confirmation rules were mirrors, and the archive inspected them with an always-in-market mechanical-bias-test rather than as a complete execution system.
Why exchange-wide advancing issues are awkward to systematize
Exchange-wide advancing-issue totals are treated as a whole-market breadth reading. They are unbounded, and their membership can change. The write-up flags that combination as especially awkward for systematic end-of-day use.
That open series is broad-market-advancing-issues: the exchange-wide daily total of issues that closed higher, with no fixed membership and no upper bound.
How the replacement count is built
Advance-issues-momentum replaces that open-ended tape count with the number of names in a predetermined basket that have positive n-day close-to-close momentum. N-day-momentum is the latest close minus the close n trading sessions earlier.
An issue is counted as advancing only when the latest close is above the close n sessions earlier. The indicator is that daily headcount, with a second parameter that can drop specified symbols from the tally.
The worked example used the 30 industrial-average constituents as the fixed-symbol-basket and plotted a 20-day lookback against a related large-cap index future. That future was excluded from the count. A fixed-symbol-basket is a predetermined roster chosen to represent the market of the timed instrument so the breadth count has a stable maximum.
What a fixed roster changes on the chart
Because the roster size is fixed, the count is range-bounded. Overbought and oversold zones can be stated as stable thresholds. A separate declining-issue series is unnecessary, and double-top or double-bottom comparisons are less ambiguous than on an unbounded exchange total.
Chart extremes in the 20-day series were described as often lining up with important turns, especially after the count had run to an extreme and then reversed. One cited sequence moved from a reading below 5 to the 30 ceiling in August 2002 before a later decline.
How the turning-point rules were written and checked
Turning-point-confirmation is consecutive breadth moves in one direction followed by a small reversal that stays inside a stated band. The long pattern required two successive declines, then an uptick that stayed below 20 and rose by fewer than 5 points. The short pattern was the mirror image and required the reading to stay above 10.
The evaluation procedure stayed in the market at all times with one contract, used no stops and no commissions, and covered 1 January 1998 through 30 May 2003. That setup is a mechanical-bias-test: an always-in-market long and short rule set used to ask whether a pattern has directional lean, not whether a complete execution system has been specified.
Dow-30 AIM bias test: closed-net-profit percent by book
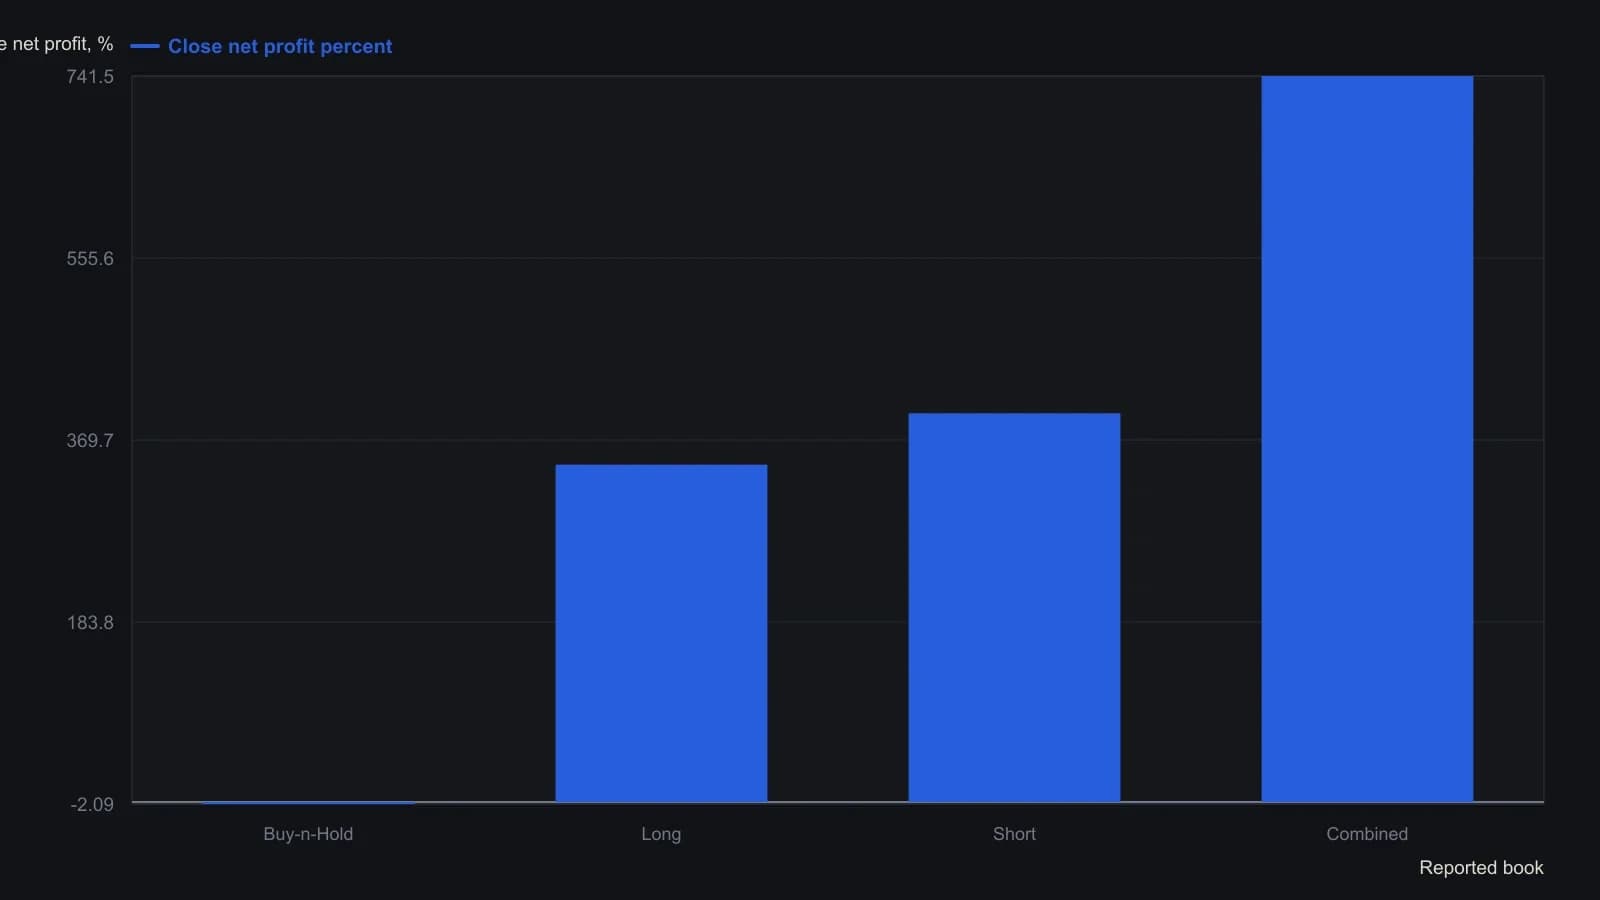
Source test window is January 1, 1998 through May 30, 2003 on one e-mini S&P contract, no stops, no commissions, always in the market. Combined closed net profit of $74,150.00 plus open-position P/L of -$4,912.50 equals the $69,237.50 total profit stated in the article.
All readings on this track · 51 readings
- 1984Half-cycle differencing for momentum signals
- 1987Relative strength evaluation under competing optimization criteria
- 1988Weekly MACD as a two-clock momentum confirmation stack
- 1989Equal-weight zero-cross from smoothed spreads
- 1989Testing relative-strength-index reversal rules against trend continuation
- 1989Smoothed three-day futures filter for index option bounces
- 1989Cycle-length windows for momentum, Relative Strength Index, and stochastic construction
- 1991Filtered rally magnitude as a bull-regime breakout
- 1992Constructing true strength from double-smoothed momentum
- 1992Constructing a double-smoothed true strength index
- 1993When momentum structure and breadth break together
- 1993Constructing double-smoothed range and momentum oscillators
- 1993Constructing a two-parameter relative momentum index
- 1993Building a bounded momentum oscillator with RSI smoothing
- 1993Two-speed oscillators with divergence and trendline gates
- 1993Constructing a relative momentum index from the relative strength index
- 1994Constructing daily advance-decline breadth tools
- 1994Building a composite regime score from monetary climate and weekly trend
- 1994Averaging Relative Strength Index and the stochastic oscillator into one reversal oscillator
- 1995Dividend-yield regression as a hold versus momentum gate
- 1996Jump and hold filters for long-term Treasury yield direction
- 1997Constructing extendedness from a 10 percent swing filter
- 1997A range-expansion oscillator that can refuse its own stretch
- 1997RSI trend permission and Fibonacci pullback rules
- 1998Nested midpoint construction for a range-normalized oscillator
- 1999Evaluating Relative Strength Index momentum with zero-line and threshold rules
- 1999Treat RSI and momentum as three mechanical procedures
- 2000Thrust strength figure from moving-average swings
- 2001Constructing a non-range-bound balance of market power score
- 2004Cleaned breadth oscillator and new-high divergence: a swing-market case file
- 2004Evaluating advance-issues-momentum on a fixed-symbol-basket
- 2004Constructing a trend filter from two adjacent high-low windows
- 2006A dollar-versus-commodity extreme as a regime case
- 2008Zero-centered stochastic bands and bracket stops
- 2012Evaluating engulfing momentum across hold windows
- 2012Staged stops as one mechanical entry and exit procedure
- 2012Stacking a relative-strength-index forecast, a trend filter, and long-only momentum
- 2013Constructing fair-value filters from averages and momentum
- 2014Constructing a multi-window slope divergence entry
- 2015Bandedge trend filter construction with inverse crossover rules
- 2017Opposite rules for index price and volatility momentum
- 2018A three-state overlay that colors a trend only after the line clears the bar
- 2018Half-cycle relative-strength index with a Fisher map for cyclic reversals
- 2018Emotion as a rule input when momentum breaks
- 2018Two-bar body expansion as a momentum breakout construction
- 2019Pair a two-day high breakout with a volume-weighted exit on the same chart
- 2020Building reflex and trendflex cross and extreme entry rules
- 2020Construct a dual-series price momentum oscillator overlay
- 2020A multi-timeframe stochastic as a panel of weekly voters
- 2020Centerline crossovers that compare index momentums
- 2020Multi-timeframe stochastic voting as one mechanical rule