2020issue C0816-21
Construct a dual-series price momentum oscillator overlay
Two matching oscillator series on one pane turn relative strength into a construction problem. The same lookbacks, the same zero line, and the same signal-line turns become explicit rules rather than a ranked list.
- Each oscillator series is a one-period percent price change, a 35-period custom exponential smoother, a scale factor of 10, and a 20-period custom exponential smoother.
- The custom smoothing multiplier is 2 divided by the time period and does not add 1 to the period the way a standard exponential moving average does.
- Matching 35, 20, and 1 settings on one pane let index or sector momentum be compared without a ranked list.
- Momentum, centerline, and signal-line crossovers are the named tests. The oscillator can produce whipsaws and is specified to be used with other filters.
A same-chart overlay, not a ranked list
The compare price momentum oscillator is a same-chart overlay of two oscillator series. The construction places those series on one pane with matching 35, 20, and 1 settings so index or sector momentum can be compared without a ranked list.
Both traces share one scale. Relative strength is then read from the two PMO lines rather than from a ranking table.
How each PMO line is assembled
Each compared oscillator is built from a one-period percent price change, then a 35-period custom exponential smoother, a scale factor of 10, and a 20-period custom exponential smoother. The sample implementation uses a one-period percent change of the close and those same two smoothers and scale.
The finished trace is the PMO line: the twice-smoothed, scaled one-period rate-of-change series that is the main momentum trace.
In this construction, the relative strength index is an oscillator that converts one-period price change into a smoothed momentum series so two markets can be compared on the same scale.
Custom smoothing and the PMO signal line
The custom smoother uses a custom smoothing multiplier of 2 divided by the time period. It does not add 1 to the period the way a standard exponential moving average does.
Moving average, here, means that custom-multiplier exponential smoother applied twice to the rate-of-change series, plus a separate exponential average used as the signal line.
The PMO signal line is a 10-period exponential moving average of the oscillator line. It is defined to trail that line so turns can be marked. The sample implementation takes a 10-period exponential average of the second series, the 20-period output, as that signal.
Weekly PMO of the S&P 500 versus the NYSE TICK
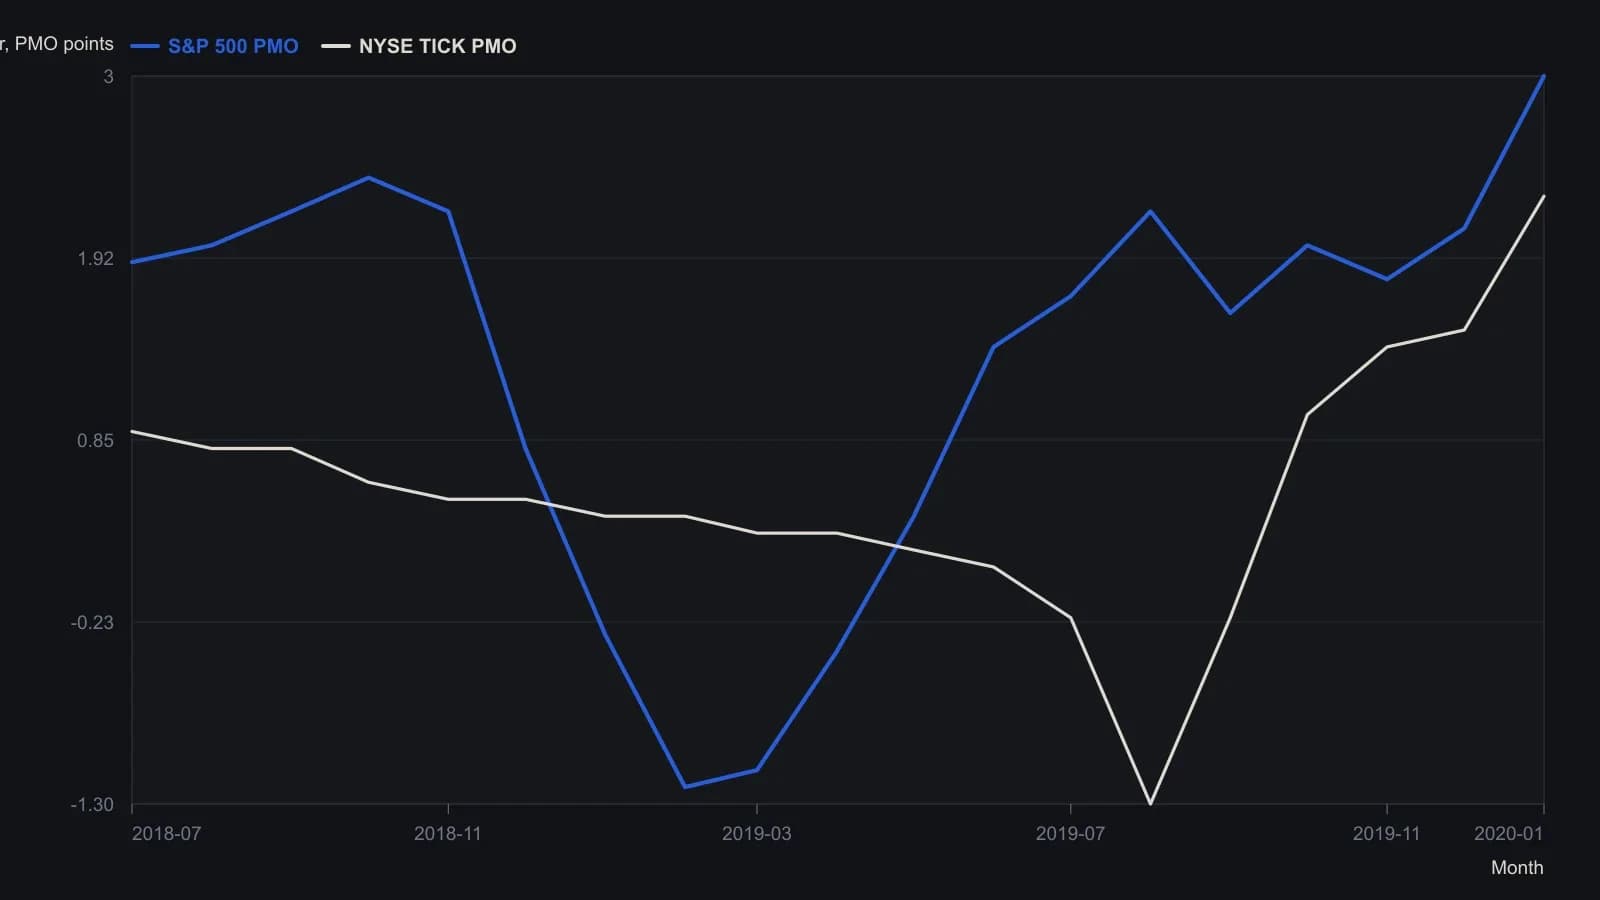
Both plots use the article defaults of 35 and 20 periods on weekly bars. Except for the labeled 2.29 finish on TICK, y-values are approximate raster readings (one decimal). The S&P 500 PMO finishes at the top of the displayed scale.
Crossovers as testable rules
A momentum strategy in this workflow is a procedure that turns entry, exit, and abstention into one testable rule set from compared oscillator lines, zero-line tests, and signal-line turns.
A bullish momentum crossover is one index oscillator line turning up through another. A bearish momentum crossover is the reverse turn through. That momentum crossover is read as a relative-strength change.
A bullish centerline crossover is the oscillator line moving above zero. A bearish centerline crossover is the oscillator line moving below zero. The centerline crossover marks a change from negative to positive momentum, or the reverse.
A bullish signal-line crossover is the oscillator line turning up through its signal line. A bearish signal-line crossover is the reverse turn through.
Crossovers are described as lasting from a few days to a few months, depending on the strength of the move.
Whipsaws and companion filters
The oscillator can produce whipsaws. A whipsaw is a short-lived crossover that reverses before a usable hold.
The construction treats that as a reason to combine the oscillator with other filters such as moving averages or chart patterns.
All readings on this track · 51 readings
- 1984Half-cycle differencing for momentum signals
- 1987Relative strength evaluation under competing optimization criteria
- 1988Weekly MACD as a two-clock momentum confirmation stack
- 1989Equal-weight zero-cross from smoothed spreads
- 1989Testing relative-strength-index reversal rules against trend continuation
- 1989Smoothed three-day futures filter for index option bounces
- 1989Cycle-length windows for momentum, Relative Strength Index, and stochastic construction
- 1991Filtered rally magnitude as a bull-regime breakout
- 1992Constructing true strength from double-smoothed momentum
- 1992Constructing a double-smoothed true strength index
- 1993When momentum structure and breadth break together
- 1993Constructing double-smoothed range and momentum oscillators
- 1993Constructing a two-parameter relative momentum index
- 1993Building a bounded momentum oscillator with RSI smoothing
- 1993Two-speed oscillators with divergence and trendline gates
- 1993Constructing a relative momentum index from the relative strength index
- 1994Constructing daily advance-decline breadth tools
- 1994Building a composite regime score from monetary climate and weekly trend
- 1994Averaging Relative Strength Index and the stochastic oscillator into one reversal oscillator
- 1995Dividend-yield regression as a hold versus momentum gate
- 1996Jump and hold filters for long-term Treasury yield direction
- 1997Constructing extendedness from a 10 percent swing filter
- 1997A range-expansion oscillator that can refuse its own stretch
- 1997RSI trend permission and Fibonacci pullback rules
- 1998Nested midpoint construction for a range-normalized oscillator
- 1999Evaluating Relative Strength Index momentum with zero-line and threshold rules
- 1999Treat RSI and momentum as three mechanical procedures
- 2000Thrust strength figure from moving-average swings
- 2001Constructing a non-range-bound balance of market power score
- 2004Cleaned breadth oscillator and new-high divergence: a swing-market case file
- 2004Evaluating advance-issues-momentum on a fixed-symbol-basket
- 2004Constructing a trend filter from two adjacent high-low windows
- 2006A dollar-versus-commodity extreme as a regime case
- 2008Zero-centered stochastic bands and bracket stops
- 2012Evaluating engulfing momentum across hold windows
- 2012Staged stops as one mechanical entry and exit procedure
- 2012Stacking a relative-strength-index forecast, a trend filter, and long-only momentum
- 2013Constructing fair-value filters from averages and momentum
- 2014Constructing a multi-window slope divergence entry
- 2015Bandedge trend filter construction with inverse crossover rules
- 2017Opposite rules for index price and volatility momentum
- 2018A three-state overlay that colors a trend only after the line clears the bar
- 2018Half-cycle relative-strength index with a Fisher map for cyclic reversals
- 2018Emotion as a rule input when momentum breaks
- 2018Two-bar body expansion as a momentum breakout construction
- 2019Pair a two-day high breakout with a volume-weighted exit on the same chart
- 2020Building reflex and trendflex cross and extreme entry rules
- 2020Construct a dual-series price momentum oscillator overlay
- 2020A multi-timeframe stochastic as a panel of weekly voters
- 2020Centerline crossovers that compare index momentums
- 2020Multi-timeframe stochastic voting as one mechanical rule