1987issue C021-5
Relative strength evaluation under competing optimization criteria
A nearby Treasury bond futures simulation from December 2, 1980 through December 1, 1985 scored relative strength, momentum, and dual moving-average procedures against five separate objectives. Rules chosen for average winning trade or average losing trade produced only a few completed turns.
- System optimization scores one full trading procedure against a single stated objective and keeps only the parameter set that ranks first on that objective.
- When the search targeted average winning trade, a 16-day relative strength index with a buy level of 24 and a sell level of 96 produced only three trades in the five-year sample.
- Parameter sets chosen to minimize average losing trade for a 6-day momentum rule, the high-low oscillator, and a 6-day relative strength index each produced only a few trades over the same window.
- Editorial view: treat the evaluation as a test of the objective that selected the parameters, and publish that objective, the search grid, and the trade count beside any reported result.
What the evaluation tested
The archive workflow asked whether a relative strength index or a related momentum procedure still looked active after system optimization scored it against more than one objective. The relative strength index was a bounded oscillator built from ordered closes over a chosen lookback and then turned into long, short, or flat signals with separate buy and sell thresholds. The momentum strategy was a complete entry, exit, and abstention procedure that compared a lookback price change with buy and sell thresholds and held the resulting position for the system horizon. Dual moving-average rules were enumerated on the same sample so each indicator procedure could be optimized separately.
How the bond series was built
The evaluation simulated nearby long-term U.S. Treasury Bond futures from December 2, 1980 through December 1, 1985. The nearby-contract-roll stayed on the front futures listing and switched on the first trading day of the expiration month. Simulated fills were taken at the open, and each completed turn was charged a 100-dollar commission. Because of thirty-seconds-encoding, prices quoted in 32nds were converted to decimals before indicator and trade calculations so a one-tick advance would not be treated as a large noncontiguous jump.
The search grids
Dual moving-average rules were enumerated over 266 combinations by stepping the short average from 2 to 15 days by ones and the long average from 6 to 60 days by threes. Momentum rules were enumerated over 5,000 combinations by stepping lookback days from 6 to 20 by twos, raising the sell threshold from 100 to 604 by 21s, and lowering the buy threshold from -100 to -604 by 21s.
Five separate objectives
Each indicator procedure was optimized separately against five criteria: total profit, short-side profit, long-side profit, average winning trade, and average losing trade. System optimization scored one full trading procedure against a stated objective and kept the parameter set that ranked first on that objective alone. The optimization criterion was that single statistic.
Trade counts under two criteria
When the search targeted average winning trade, a 16-day relative strength index with a buy level of 24 and a sell level of 96 produced only three trades in the five-year sample. Parameter sets chosen to minimize average losing trade for a 6-day momentum rule, the high-low oscillator, and a 6-day relative strength index each produced only a few trades over the five-year window.
Trade counts when T-bond parameters were chosen to minimize average loss
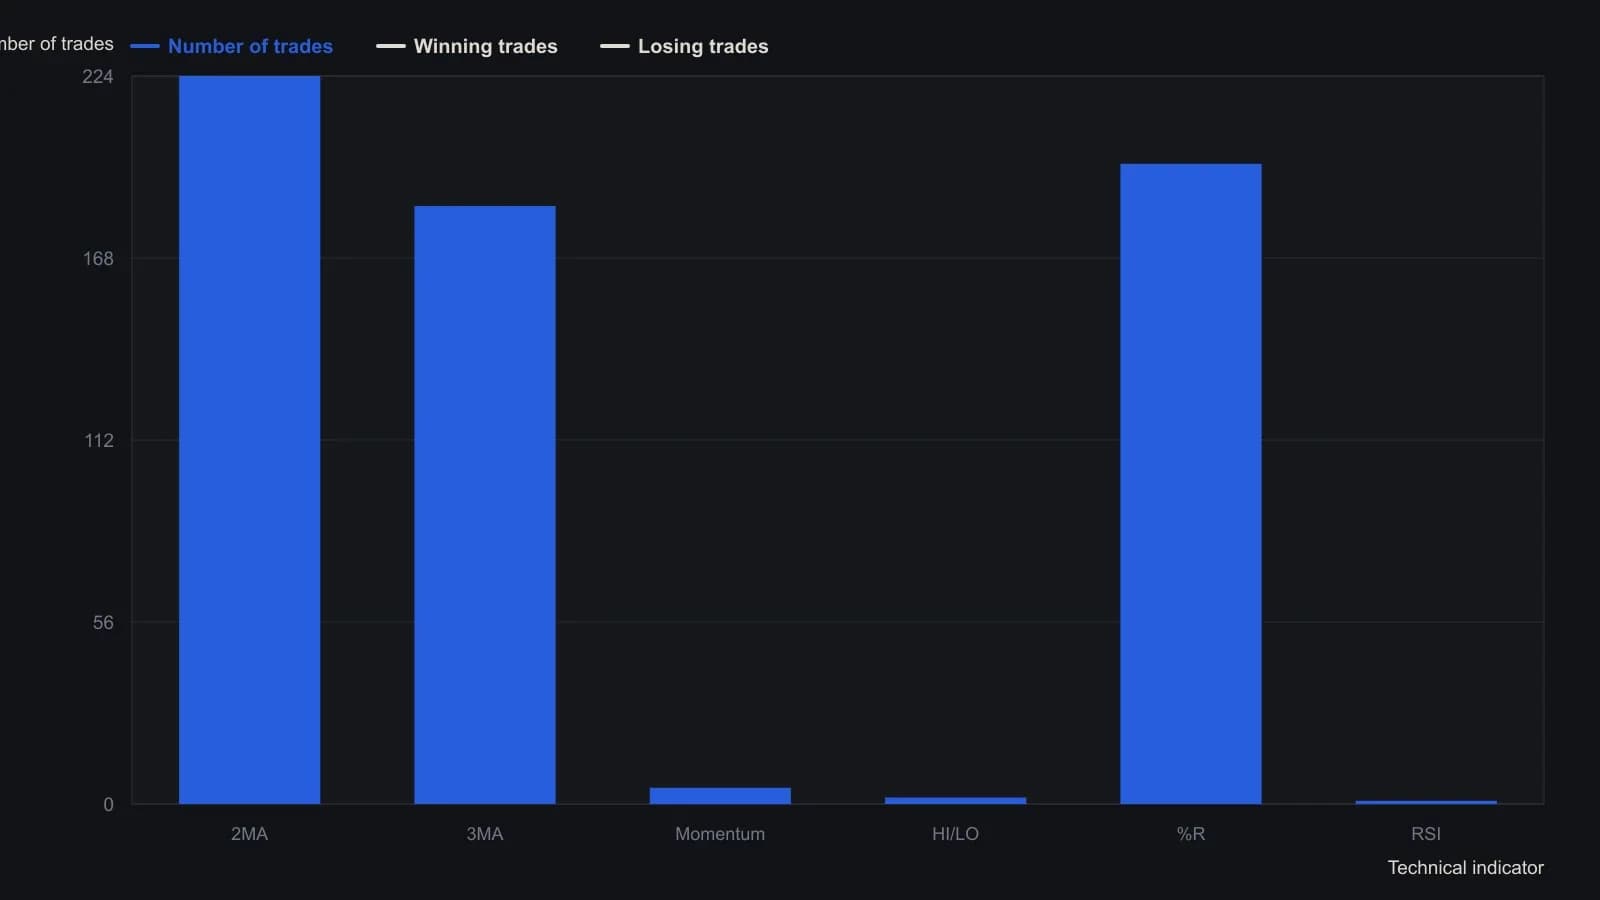
Fills were at the open with a $100 round-turn commission on the nearby Chicago Board of Trade T-bond contract, rolled on the first session of the expiration month. Under this objective a 6-day momentum, the high-low oscillator, and a 6-day RSI each recorded only winning trades.
All readings on this track · 51 readings
- 1984Half-cycle differencing for momentum signals
- 1987Relative strength evaluation under competing optimization criteria
- 1988Weekly MACD as a two-clock momentum confirmation stack
- 1989Equal-weight zero-cross from smoothed spreads
- 1989Testing relative-strength-index reversal rules against trend continuation
- 1989Smoothed three-day futures filter for index option bounces
- 1989Cycle-length windows for momentum, Relative Strength Index, and stochastic construction
- 1991Filtered rally magnitude as a bull-regime breakout
- 1992Constructing true strength from double-smoothed momentum
- 1992Constructing a double-smoothed true strength index
- 1993When momentum structure and breadth break together
- 1993Constructing double-smoothed range and momentum oscillators
- 1993Constructing a two-parameter relative momentum index
- 1993Building a bounded momentum oscillator with RSI smoothing
- 1993Two-speed oscillators with divergence and trendline gates
- 1993Constructing a relative momentum index from the relative strength index
- 1994Constructing daily advance-decline breadth tools
- 1994Building a composite regime score from monetary climate and weekly trend
- 1994Averaging Relative Strength Index and the stochastic oscillator into one reversal oscillator
- 1995Dividend-yield regression as a hold versus momentum gate
- 1996Jump and hold filters for long-term Treasury yield direction
- 1997Constructing extendedness from a 10 percent swing filter
- 1997A range-expansion oscillator that can refuse its own stretch
- 1997RSI trend permission and Fibonacci pullback rules
- 1998Nested midpoint construction for a range-normalized oscillator
- 1999Evaluating Relative Strength Index momentum with zero-line and threshold rules
- 1999Treat RSI and momentum as three mechanical procedures
- 2000Thrust strength figure from moving-average swings
- 2001Constructing a non-range-bound balance of market power score
- 2004Cleaned breadth oscillator and new-high divergence: a swing-market case file
- 2004Evaluating advance-issues-momentum on a fixed-symbol-basket
- 2004Constructing a trend filter from two adjacent high-low windows
- 2006A dollar-versus-commodity extreme as a regime case
- 2008Zero-centered stochastic bands and bracket stops
- 2012Evaluating engulfing momentum across hold windows
- 2012Staged stops as one mechanical entry and exit procedure
- 2012Stacking a relative-strength-index forecast, a trend filter, and long-only momentum
- 2013Constructing fair-value filters from averages and momentum
- 2014Constructing a multi-window slope divergence entry
- 2015Bandedge trend filter construction with inverse crossover rules
- 2017Opposite rules for index price and volatility momentum
- 2018A three-state overlay that colors a trend only after the line clears the bar
- 2018Half-cycle relative-strength index with a Fisher map for cyclic reversals
- 2018Emotion as a rule input when momentum breaks
- 2018Two-bar body expansion as a momentum breakout construction
- 2019Pair a two-day high breakout with a volume-weighted exit on the same chart
- 2020Building reflex and trendflex cross and extreme entry rules
- 2020Construct a dual-series price momentum oscillator overlay
- 2020A multi-timeframe stochastic as a panel of weekly voters
- 2020Centerline crossovers that compare index momentums
- 2020Multi-timeframe stochastic voting as one mechanical rule