1989issue C031-7
Reversal count as the clock on point-and-figure charts
A point-and-figure chart has no time scale on the horizontal axis. A new column is added only after a qualifying price reversal. This archive article sets the same tape on a one-box chart and a three-box reversal, then follows congestion, a drawn trendline, and a later breakout as one sequence.
- A point-and-figure chart adds a new column only after a qualifying reversal, so a stretch of calendar time that never warrants a mark leaves the chart blank.
- Sensitivity is set by vertical point size and box-reversal count: a one-box chart opens a new column after a one-box contrary move, while a three-box reversal still plots each one-point print but needs three boxes to shift columns.
- Three-box reversal charts are presented as the clearer surface for long- or intermediate-term trendlines; one-box charts keep more short-term detail for finer pattern work.
- A congestion zone, a trendline across successive lower highs or higher lows, and a later breakout are read as one sequence, and the construction is described as rarely producing a rapid flip-flop of opposing signals.
How columns replace the calendar
A point-and-figure chart has no time scale on the horizontal axis. A new column is added only after a qualifying price reversal.
Rising prices are marked with X and falling prices with O. The first print of a month uses a month code, with October, November, and December often written as A, B, and C.
If price never moves enough to warrant a mark, that stretch of calendar time leaves the chart blank, so some months never appear.
Point size and box-reversal
Sensitivity is set by vertical point size and reversal box count. A 1×1 chart opens a new column after a one-box reversal, while a 1×3 chart still plots each one-point print but needs a three-box reversal to shift columns.
On the illustrated stock near 30, a 1×1 construction treated about a 3 percent move as a mark, whereas a 1×3 construction needed about a 10 percent reversal to change columns and compressed nearly eight years into a short panel.
Three-box reversal charts are presented as the clearer surface for long- or intermediate-term trendlines. One-box charts keep more short-term detail for finer pattern work.
Trendlines, triangles, and breakout
A downtrend line joins tops of columns of successively lower highs. An uptrend line joins bottoms of successively higher lows. When those lines converge into a triangle, the later directional break is treated as the next-path clue.
A breakout is a print that leaves a congestion zone or crosses a drawn trendline and thereby makes the next-path hypothesis testable.
Two case studies of congestion and breakout
In the first case study, a congestion zone between 23 and 26 to 27 was followed by a June 1987 rise through 28, read as a breakout above the band. Later 1988 lower highs and a print through the band floor to 25 were read as a downward break.
In the second case study, an upside breakout from a 23 to 26 congestion zone at 27 carried a width-based objective of 33. A descending trendline of 1987 lower peaks was treated as a lid until it was broken in April 1988.
A flag, a brief pause after an advance, is used in the cases to locate a protective exit level. The construction is described as rarely producing a rapid flip-flop of opposing signals.
American Telephone 1×1: named prints from the 1987 break to the 1988 low
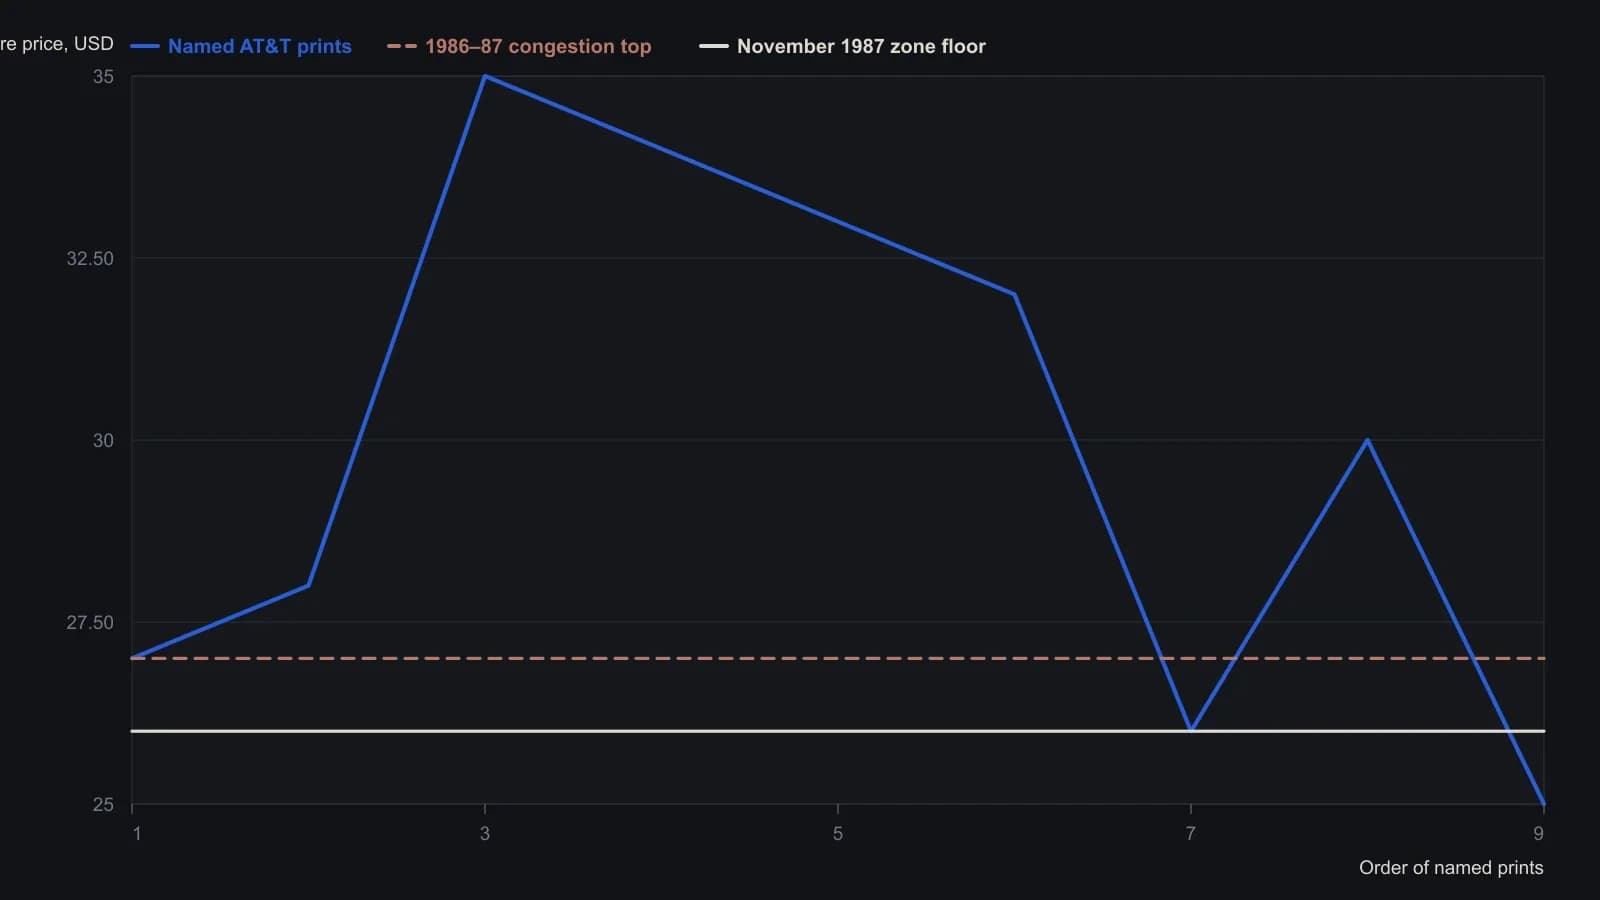
Box size is one dollar with a one-box reversal, about 3 percent on this $30 stock. Horizontal order is the sequence of prices named in the text, not elapsed time and not a column-by-column read of the X-O grid.
All readings on this track · 30 readings
- 1988Constructing trend definitions with filters and lines
- 1989Reversal count as the clock on point-and-figure charts
- 1989Point-and-figure setup and session-average entry windows
- 1989Two-scale point-and-figure trendlines and stop placement
- 1989Adjusted net asset value, tighter reversals, and written stops on a fund point-and-figure chart
- 1990Stack option odds after point-and-figure signals
- 1991Constructing a point-and-figure downtrend-break
- 1991Constructing point-and-figure box and reversal charts
- 1991Constructing a close-tested one-two ladder on a point-and-figure chart
- 1992Point-and-figure, breadth, and volume as falsifiable hypotheses
- 1992Three-gate stock selection with ranks and point and figure
- 1993Constructing combined stochastics and point-and-figure relative strength
- 1997Point-and-figure box scale and reversal construction
- 2000Cotton weekly point-and-figure: late-stage decline, named weekly close
- 2000Constructing point-and-figure charts for support, resistance, and breakouts
- 2001Swiss franc: seasonal permission and a weekly point-and-figure breakout
- 2001Constructing point-and-figure boxes and reversals
- 2002Point-and-figure construction: box, live column, and three-box reversal
- 2003E-mini point-and-figure box-size and a descending-triangle breakout
- 2003A reconstruction critique of point-and-figure daytrading
- 2004Point-and-figure column moving-average crossovers
- 2005Box-series transforms for trend and channel work
- 2006Constructing bearish point-and-figure support breaks
- 2008Point-and-figure forex breakouts and triangles
- 2012From tactile charts to written trade rules
- 2013Combine a Point and figure chart and Moving-average crossover inside one System optimization procedure
- 2015Point-and-figure time and volume limits are conventions to test
- 2016Measurement-first critique of indicator defaults
- 2017Point-and-figure construction, reversals, and column-based overlays
- 2019A 2019 charting case as a three-check trend classroom