1986issue C021-6
Volume confirmation, the negative volume index, and divergence
Session volume is first compared with a 10-day average of listed-exchange activity. A signed volume line, a separate up-minus-down cumulative series, a negative volume index updated only on quieter days, and a 10-day upside-volume sum are then read for price-volume confirmation or price-indicator divergence.
- A 10-day moving average of daily listed-exchange volume is the volume baseline for deciding whether a session is expanded or contracted.
- A congestion breakout is treated as more convincing when volume expands by at least 20 percent versus that baseline, while a selling-climax expansion after an extended decline is judged by a larger increase, on the order of 40 percent.
- The volume line and a separate up-minus-down cumulative series are read for price-volume confirmation at new highs and for an earlier turn, preferably a double bottom, at lows.
- The negative volume index updates only on quieter sessions. Opposite movement versus the composite, or lower peaks in a 10-day upside-volume sum against higher composite peaks, is treated as price-indicator divergence.
Start with a measurable volume baseline
The historical workflow first builds a volume baseline so expansion and contraction are measurable. A volume baseline is a short moving average of daily activity used as the reference for judging whether a session is expanded or contracted. The reference used here is a 10-day moving average of daily listed-exchange volume.
Volume is expected to expand when price travels with the intermediate trend, contract when price moves against that trend or inside congestion, and often swell near trend-reversal points. A congestion breakout is treated as more convincing when that day's volume expands by at least 20 percent versus the 10-day average. A candidate selling-climax expansion after an extended decline is judged by a larger expansion, on the order of 40 percent.
Read the volume line against the composite
A volume line is a running total that adds session volume on an up close of the broad composite and subtracts it on a down close, then is plotted against price. It is used to test whether new price highs are led or promptly confirmed by new highs in that line. That agreement is price-volume confirmation.
Non-confirmation of a new composite high by the volume line is read as incomplete internal participation, not as a standalone sell signal. At bottoms the same line is expected to turn first and preferably form a double bottom several days or weeks before the composite.
A second cumulative series that each day adds up-volume minus down-volume, without using the composite's direction, is interpreted the same way: price-volume confirmation of new highs, an earlier turn at lows, and non-confirmation as a meaningful price-indicator divergence.
Update the negative volume index only on quieter days
The negative volume index is a cumulative line updated only on sessions whose volume is lower than the prior session, using that day's advance-minus-decline difference. A constructive reading is that this quiet-day line rises with the composite. Opposite movement is treated as negative price-indicator divergence.
Watch fading upside force and a volume oscillator
A 10-day sum of upside volume that prints successively lower peaks while the composite prints higher peaks is treated as a price-indicator divergence that implies fading force behind each advance.
After 13 daily up-minus-down volume readings are in hand, subtracting the value from 12 sessions earlier and smoothing with a 10-day average yields a momentum and overbought-oversold oscillator. The historically cited zones were about +25 million and -20 million, with the caveat that a strong tape can enter the upper zone quickly and remain there for several weeks.
NYSE 10-day volume oscillator versus the New York Composite
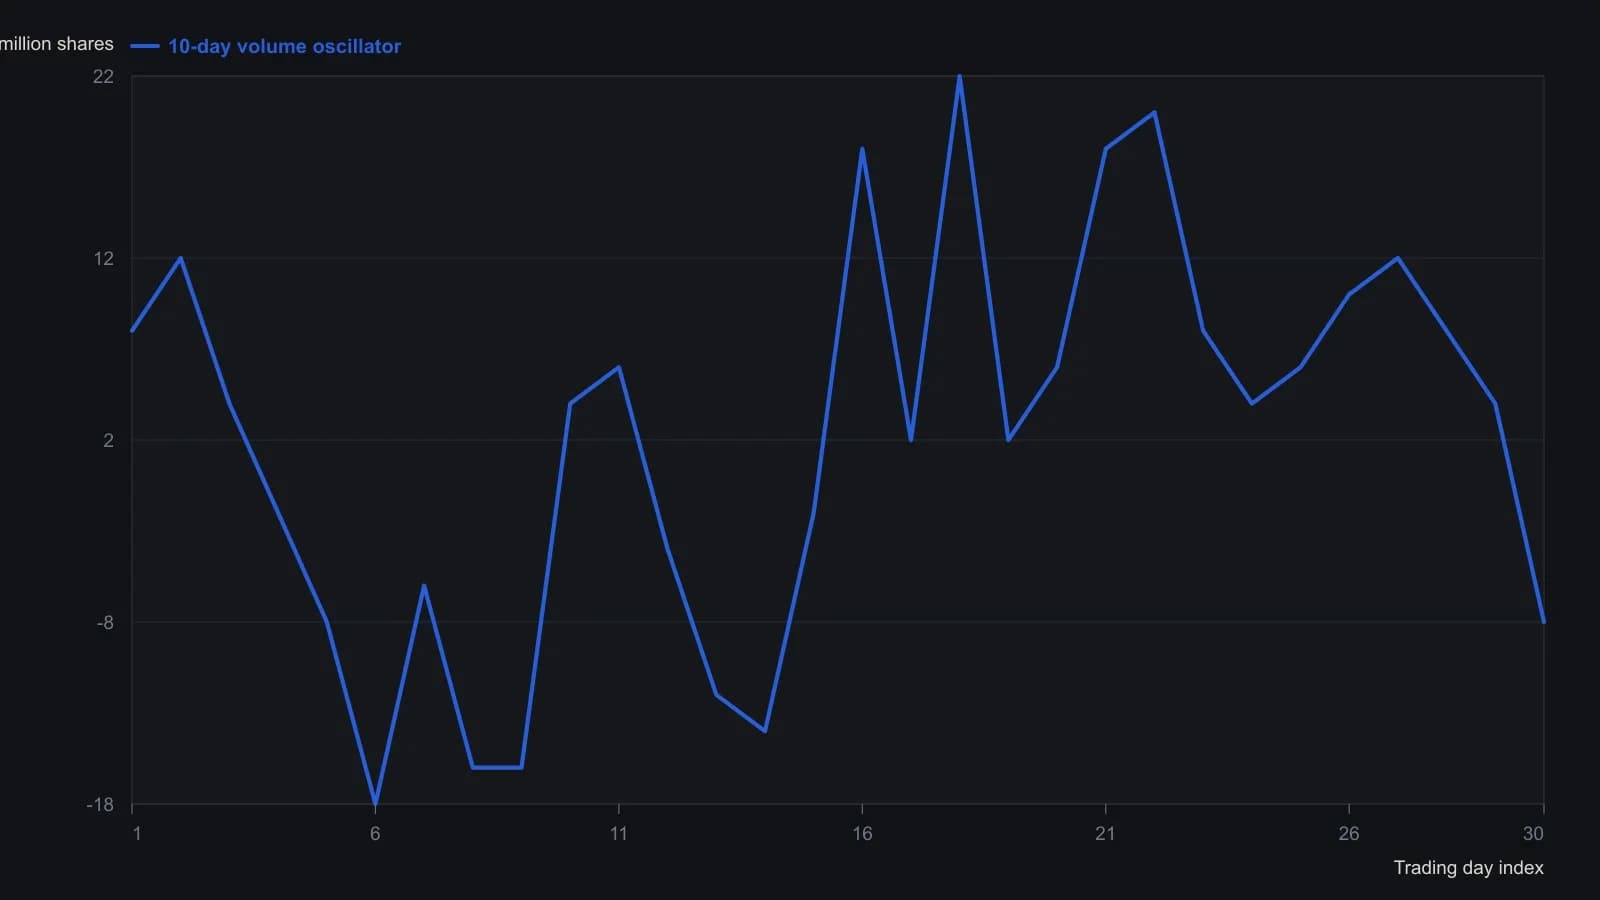
Axis labels on the scan are inverted; scales were recovered by rotating the figure and matching tick marks. Oscillator units are millions of shares. Composite prices are the left-hand scale. Digitized points are approximate.
All readings on this track · 9 readings
- 1986Volume confirmation, the negative volume index, and divergence
- 1990Constructing a signed-range negative volume line
- 1990When quiet-day breadth fails a horizon test
- 1994Stacking scored filters into a hierarchical stock outlook system
- 1996Constructing volume-split and advance-decline breadth signals
- 1996Constructing on-balance volume, volume-price analysis, and the negative volume index
- 1996Constructing volume disparity from percent-b
- 1996Constructing a price-volume percent-B disparity
- 2003Constructing a negative volume index as a moving-average regime test