1987issue C051-6
Constructing a volume-confirmed Williams %R
The price-only Williams %R stays the baseline range oscillator. The rebuild adds a short-horizon price leg, a longer-horizon price leg, a volume-agreement gate, and a length-dependent amplitude factor so confirmation, extremes, and divergence are explicit construction choices.
- The price-only Williams %R locates the gap from the lookback high to the current close inside the lookback price range, scales that ratio by 100, and is plotted inverted from 0 at the top to 100 at the bottom.
- The rebuilt index is assembled from a short-horizon price leg, a longer-horizon price leg, and a volume leg, and a signal cannot print unless the volume leg supports the price move.
- Matching signs on the modified close and volume Williams %R series confirm that a trend can continue; opposite signs are treated as a possible nearby turning point.
- A length-dependent amplitude factor and a close-change reweighting keep the composite from shrinking toward a mid-band, so readings above 70, below 30, and divergences versus price stay testable.
The price-only baseline
Williams %R is a range oscillator that locates the current close inside a lookback high-low window. The price-only form locates the gap from the lookback high to the current close inside the lookback price range, scales that ratio by 100, and is plotted inverted from 0 at the top to 100 at the bottom.
In this construction that oscillator is restated as three modified series that feed a composite index. The price-only reading remains the baseline against which the volume-gated rebuild is specified.
Dual-horizon legs and the volume gate
The rebuilt index is assembled from a short-horizon price leg, a longer-horizon price leg, and a volume leg. It is specified that a signal cannot print unless the volume leg supports the price move.
Each modified percent R is a signed, twice-scaled comparison of a series against either a half-window average or a one-bar change, normalized by that series lookback range. The three modified series are each scaled by 2 and compare volume with a half-length volume average over the period volume range, the close with a half-length close average over the period close range, and the one-bar close change with the period close range.
Trend, confirmation, and reweighting
A trend is assumed when the sign of the latest close-to-close change matches the sign of the previous modified Williams %R of the close.
Volume-price analysis is applied as a confirmation rule that asks whether a modified volume series agrees in sign with a modified close series before a trend is treated as reinforced. Matching signs on the modified close and volume Williams %R series are treated as volume-price confirmation that the trend can continue. Opposite signs are treated as a possible nearby turning point.
The composite is reweighted by the simple close-change Williams %R in two states: close and volume confirm the trend while the close is rising, or close and volume fail to confirm while the close is falling.
Amplitude factor and the fallback composite
The amplitude factor is a length-dependent scalar that keeps the composite from collapsing toward a mid-band as the study window lengthens. It is 0.25 when the study length is less than 10. When the length is greater than 10, it equals the length divided by 32 minus 1/16. That mapping is described as a trial-and-error fit so longer windows do not shrink toward a 40-to-60 band.
When those two confirmation-and-direction states are not met, the simple close-change series is set equal to the amplitude factor and the composite simplifies to 25 times the close component times the volume component plus 1, plus 2.
The three modified components are described as oscillating between 0.0 and 1.20, with values of 1 or greater treated as signals and values below 1 treated as indeterminate, so extremes print only when volume and price are highly correlated.
Tops, bottoms, and divergence
Readings above 70 and below 30 are treated as top or bottom conditions. Divergence is a chart condition in which a later price extreme is not matched by the composite, used here as a sharper turning-point hypothesis than the price-only oscillator.
Divergences versus price are described as sharper than those of the original Williams %R. On a 14-period comparison the price-only series stayed pinned through a late-November advance while a 3-period average of the composite printed an early-December divergence.
3-day average Enhanced Williams %R on December T-bonds
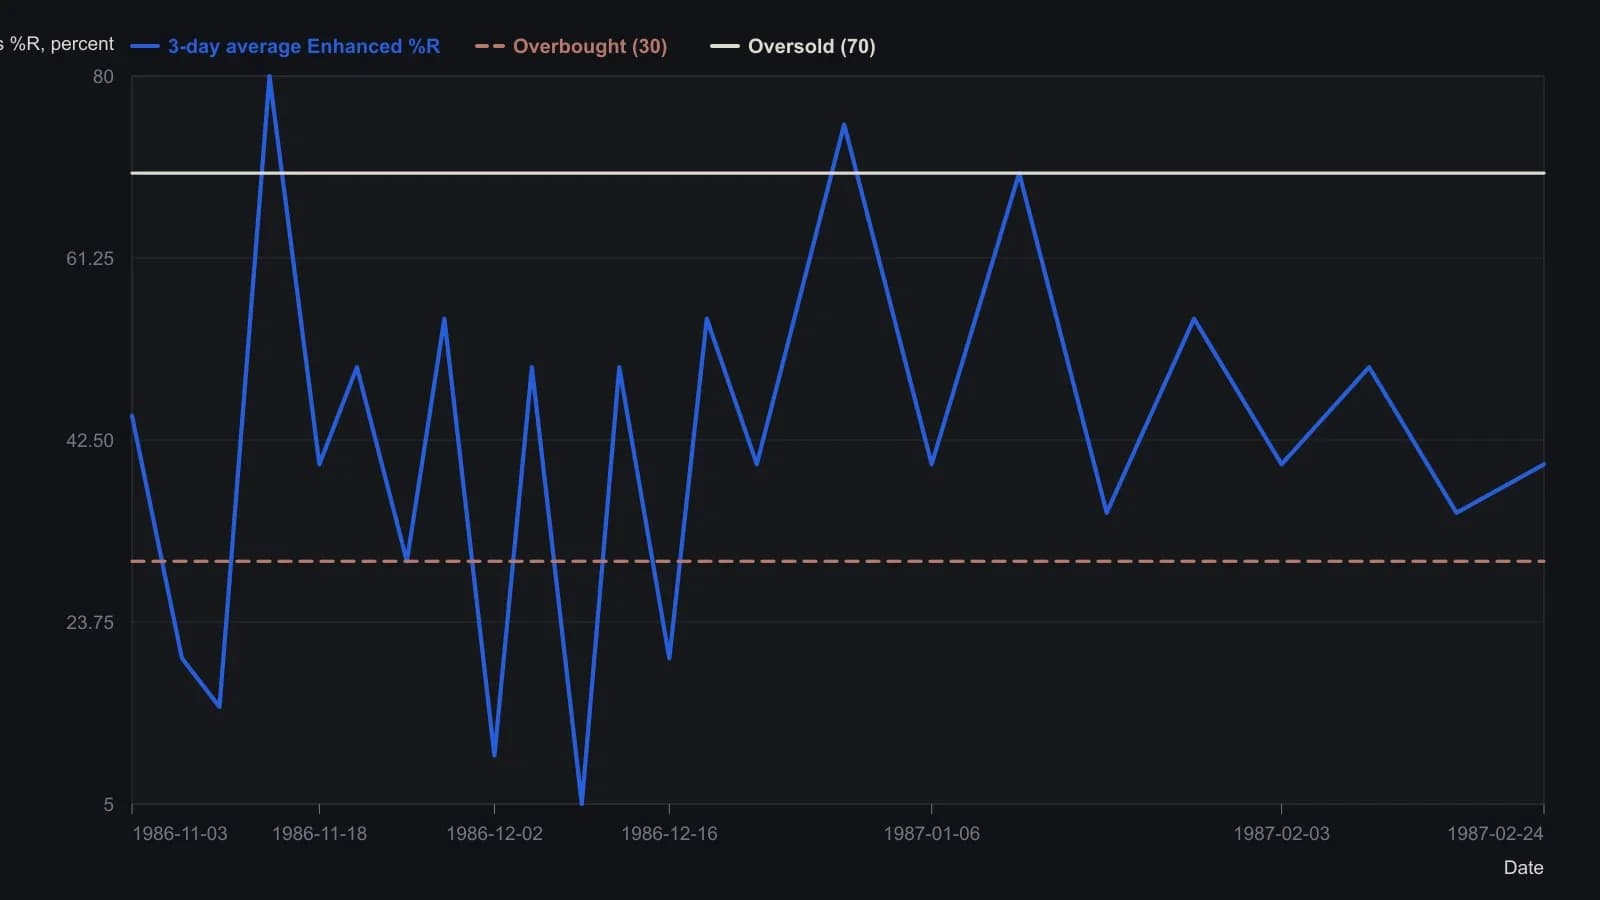
Source plots Williams %R inverted (0 at the top, 100 at the bottom). The comparison figures use a 14-day Enhanced Index; this panel is the 3-day average of that series. Digitized from the magazine raster and rounded to 5 index points.
All readings on this track · 13 readings
- 1987Constructing a volume-confirmed Williams %R
- 1991Audit inverse-range oscillators before stacking stochastic %K and Williams %R
- 1991Signed midpoint range oscillator from stochastic and Williams
- 1993Confirm an intradate candlestick only after a longer cycle reprints it
- 1994Building average directional index, the stochastic pair, and Williams percent R from highs, lows, and closes
- 1994Label the tape before you read stochastic or Williams %R
- 1996Calibrating Williams %R entries in rising channels
- 1997Dynamic zones for oscillator buy and sell levels
- 1998Regression channels anchored to Williams %R turning windows
- 1999Constructing isolated synthetic waveforms to watch indicator settling
- 2000Choosing a scale for moving-average oscillators
- 2004Splitting entry and exit speed by regime
- 2008Count the run, then confirm the pivot at a channel edge