1994issue C121-13
A pre-trade checklist that can refuse a long three ways
A pre-trade checklist can score a long as one procedure and still refuse it. The market may fail a breadth and follow-through gate, the name may fail a top-tier relative-strength comparison, or the average directional index may not yet hand the hold-versus-exit decision back to the trader.
- Score the market backdrop, the name, and the later hold test as one pre-trade checklist before a long is allowed.
- A contrary sentiment reading is not a buy until positive breadth divergence and a follow-through day confirm it.
- After the market clears, admit only names that held a cup-and-handle base, resisted the decline, and printed a high relative-strength rank at breakout.
- Treat an expanding average directional index between the directional pair as a hold rule, and treat a rise through the plus directional indicator followed by a downturn as a late-trend warning.
One score, three places to refuse
A long-side procedure can require three sequential gates before any entry: a contrary sentiment backdrop, improving internal breadth at a new index low, and a delayed follow-through rally on expanding volume. Those tests belong in one pre-trade checklist, scored together with a later hold test, before a long is allowed and while it remains open.
Editorial reading: the same score can refuse the long in three places. The market can fail the breadth and follow-through gate. The candidate can fail a top-tier relative-strength comparison over a defined lookback. Or the average directional index can withhold the hold-versus-exit decision from the trader.
Market gates that can block every name
Successive index reaction lows printed on a declining-volume sequence were treated as an argument that selling pressure was being exhausted. Daily new lows that contracted while the weighted index made a new reaction low were used as a positive breadth divergence, meaning fewer individual issues were participating in the decline.
A follow-through day was specified as a delayed confirmation bar after the exact low: an index gain of at least 1 percent on greater volume than the prior session, counted from the fourth day through the tenth. The first three days were ignored unless all three were extremely strong. The illustrated case still accepted a later advance that met volume confirmation because other checklist items already agreed.
Combined shorter-horizon and longer-horizon put/call readings, even at a record extreme, were treated as needing confirmation from breadth and price-volume tests rather than as a stand-alone buy.
NASDAQ volume at the three 1994 reaction lows
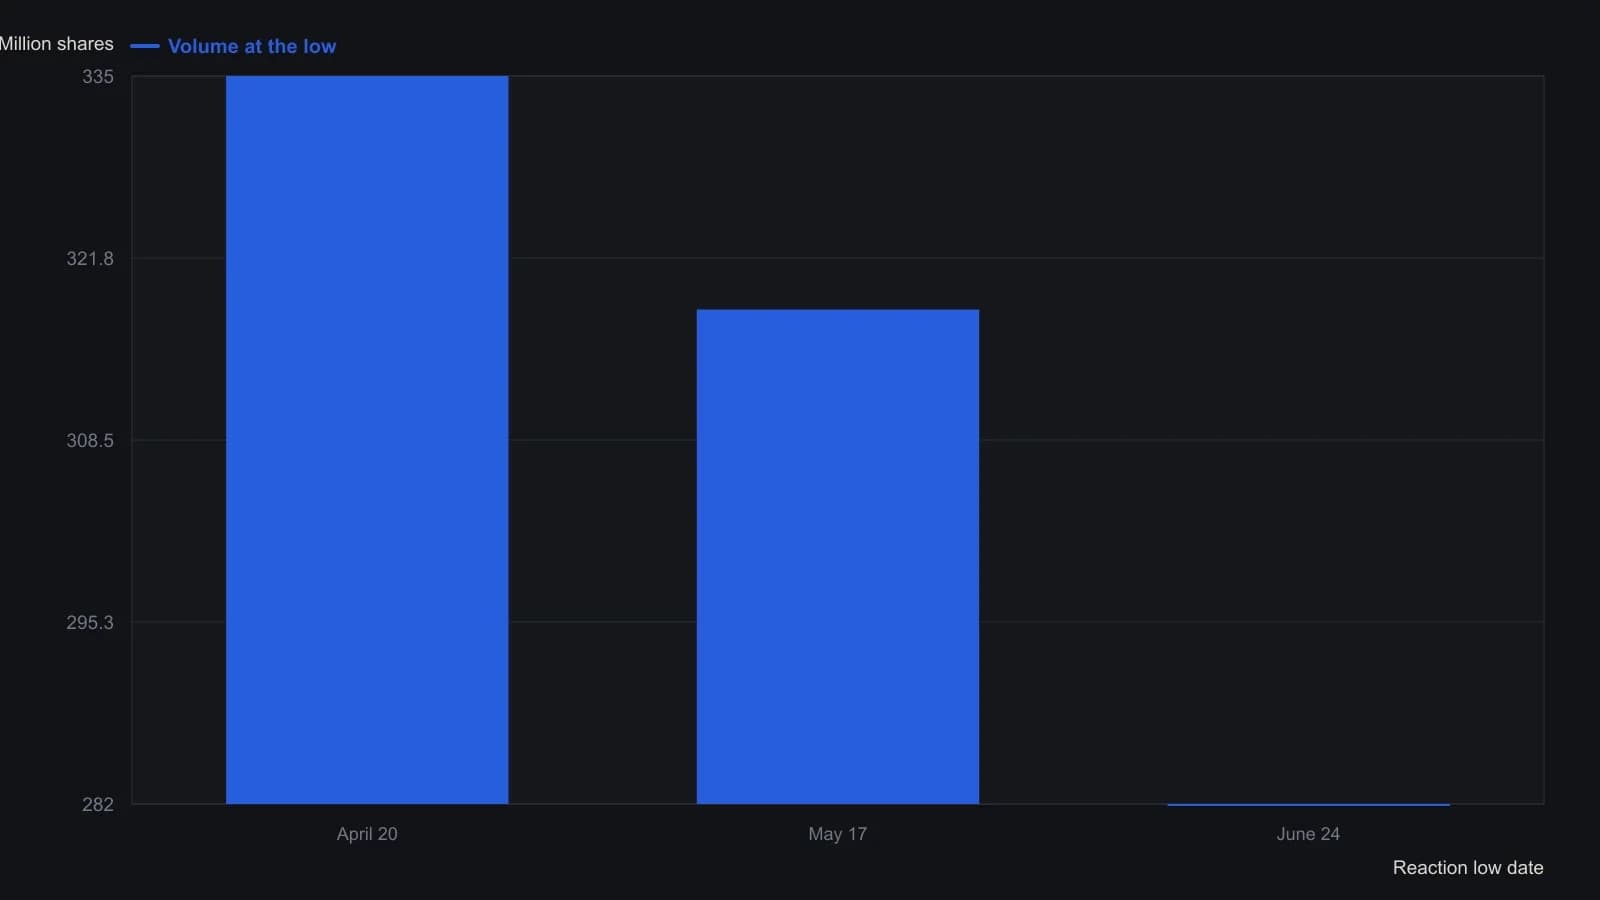
Only the three labeled reaction-low sessions are reported; this is not a continuous volume series.
The name still has to clear relative strength
After the market-level checklist cleared, names were admitted only if they held a constructive cup-and-handle base, resisted the broader decline, and printed high relative-strength ranks at breakout. The cup-and-handle base is admitted only as a pattern filter inside the larger checklist.
The relative strength index, used here, is a ranked comparison of a name's recent price behavior against a defined universe over a stated sampling interval. It is a selection gate, not a standalone forecast.
When trend strength keeps the decision
When the plus directional indicator is above the minus directional indicator and the average directional index crosses from below both and rises between them, the procedure treats the combination as a hold rule: stop re-judging the open long while the thrust remains intact.
An average directional index rise through the plus directional indicator followed by a downturn was treated as a late-trend warning that the next upward thrust may precede a deeper pullback. In the historical workflow, that sequence had marked important index peaks with a lead measured in weeks.
Editorial reading: until the average directional index hands the hold-versus-exit decision back, the checklist can still refuse a fresh long and can keep an open long from being re-judged on every bar.
All readings on this track · 56 readings
- 1986Cycle-aligned directional trend indicator
- 1987What crossover and directional entry rules actually compare
- 1988A directional-line cross needs a trend filter, an extreme-point rule, and a dollar stop
- 1988Constructing true range by offset addressing
- 1988Constructing directional movement from bar range
- 1988Average directional index construction: recursive smoothing and lookback offset
- 1988Staged Average Directional Index construction with Relative Strength Index confirmation and stop alerts
- 1988Average Directional Index construction with frozen true range and directional rules
- 1991Constructing the average directional index from range expansion and true range
- 1991Constructing five-session forecasts from stochastic, ADX, and MACD inputs
- 1993Constructing the average directional index from directional movement and true range
- 1993Confirming n-bar breakouts with ADX and DX filters
- 1994Constructing a Bollinger band-width trend filter
- 1994A pre-trade checklist that can refuse a long three ways
- 1997An ADX threshold and a moving average as a trend filter
- 1998Regime filters for mutated indicators
- 1999Building the average directional index from range extension and true range
- 2000Evaluating ADX, RSI, and moving averages in a multi-stock warehouse
- 2000Stochastic pop as a filtered continuation setup
- 2000Onset and exit from one average directional index
- 2002Joint ADX and MACD readout for trend strength and direction
- 2003Adaptive Donchian breakout with implied volatility and volume
- 2004The average directional index as a regime gate for the relative strength index and the stochastic oscillator
- 2004Constructing true-range-specified volume as a directional filter
- 2005Constructing a multi-filter penny stock breakout procedure
- 2005Construct one playbook that flips with session regime
- 2005Combining Bollinger Bands, the average directional index, and Fibonacci retracement on currency pairs
- 2006Assembling an adaptive price zone from double-smoothed averages
- 2006An ADX strength gate for MACD and the stochastic oscillator
- 2007Directional movement as a filter plus trigger
- 2007Constructing a veto-first trend permission stack
- 2007ADX gates for trend end, range, and reversal
- 2008Constructing a nine-cell directional-ratio grid
- 2008Average directional index and directional trend indicator lookbacks as trend-filter parameters
- 2008A holding-matched market lens from averages and directional-line crosses
- 2008A nine-cell directional scoreboard for multi-horizon entries
- 2010Building a Vortex Indicator from high-low distances
- 2010Constructing ADX, RSI, and MACD price filters
- 2011Constructing a volume zone oscillator with a moving-average and Average Directional Index regime filter
- 2011A volume zone oscillator conditioned by an Average Directional Index filter
- 2011Candlestick names need volume-price, ADX, and moving-average checks
- 2012Clustered average-directional-index traces as a trend-start filter
- 2012Average Directional Index cluster filters for trend-start signals
- 2012Confirming a trend start or turn with a triple ADX cluster
- 2013Constructing a late-entry stack from a signed DMI oscillator
- 2013A directional oscillator and its stochastic as a stacked timing filter
- 2013ADX cluster lookbacks are a locked specification, not a chart label
- 2013Combining moving averages, stochastics, and ADX in a daily scan
- 2015Assembling the Average Directional Index from directional movement
- 2016How an Average Directional Index filter and a breakout entry form one procedure
- 2016Score RSI and stochastic crossings only when ADX confirms the trend
- 2018Constructing an ADX filter for intraday breakouts
- 2018An ADX volatility gate for prior-day breakouts
- 2019Exponential deviation bands with a moving average, RSI and ADX
- 2020A normalized-slope trend filter from linear regression
- 2020Gating volatility-momentum divergences with a Trend filter