1998issue C061-8
Regime filters for mutated indicators
Indicator and system inputs can lose or gain timing value when market structure changes. Signals are meant to be applied only after the current structural phase, and the mutation of those inputs, has been quantified.
- Indicator and system inputs can lose or gain timing value when market structure changes. That shift in usefulness is variable mutation.
- The new market paradigm sequences contraction, expansion, and transition, and a phase is treated as correct only when it follows the expected predecessor.
- System and indicator signals are meant to be applied only after the current structural phase, and therefore the mutation of their inputs, has been quantified.
- Orders placed without regard to mutated incremental volatility can coincide with the noisiest intervals of the structure.
Variable mutation when structure changes
Indicator and system inputs can lose or gain timing value when market structure changes. That change in how useful an input remains is variable mutation.
Trending structure is a primary-trend market in which smaller retracements are treated as pullbacks inside the larger move. Nontrending structure is a sideways market that oscillates between support and resistance.
A three-phase structural envelope
The proposed structural envelope is a new market paradigm with three sequential phases: contraction, expansion, and transition.
Contraction phase is quieter congestive action with decreasing momentum. Expansion phase is extreme directional action with rising momentum. Transition phase is a momentum reversal with price reversal or retracement.
A phase is treated as correct when it follows the expected predecessor: contraction after transition, expansion after contraction, and transition after expansion.
Quantify the phase before a signal
System and indicator signals are meant to be applied only after the current structural phase, and therefore the mutation of their inputs, has been quantified.
Standard deviation measures price variance around a mean and is commonly scaled in multiples of one, two, or three deviations. Incremental volatility is a volatility measure treated as a mutable input rather than a fixed constant.
Swiss franc account return with and without a phase filter
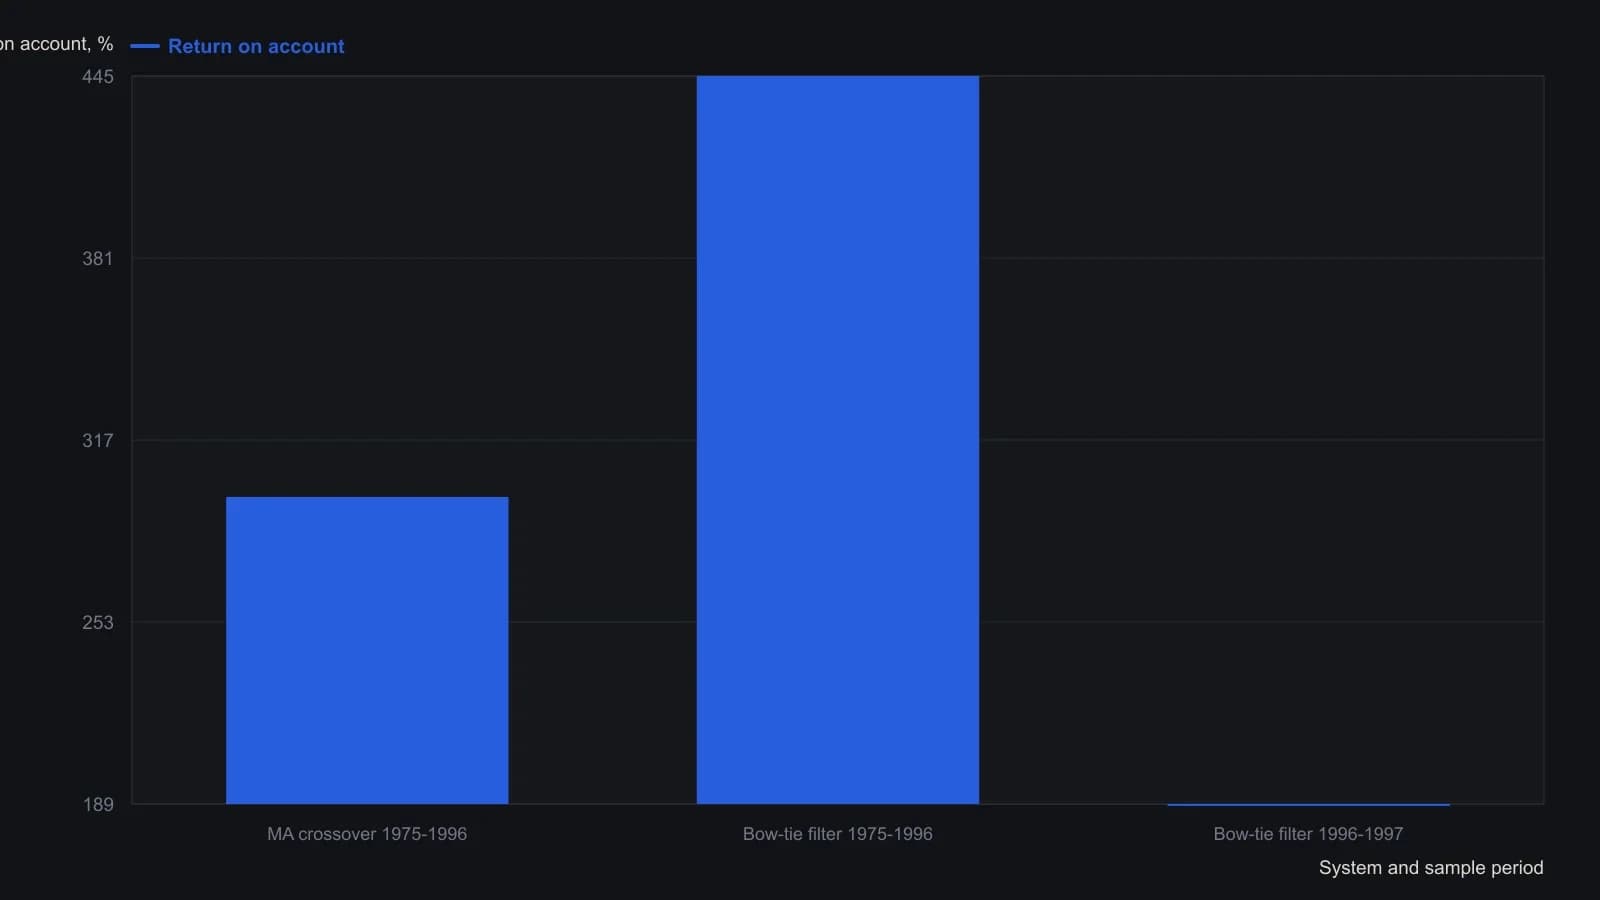
The 1996-1997 bow-tie sample is only 11 trades on the December 1997 contract and is not the same horizon as the 21-year tests. On the long sample the profit factors were 1.34 for the crossover and 1.30 for the bow-tie; the return gap comes mainly from a smaller required account (19640 versus 26300 dollars).
How the phases were marked
Paintbar and phase-indicator examples on copper, coffee, IBM, Iomega, Swiss franc, and Treasury bond charts were used to mark expansion, contraction, and transition.
All readings on this track · 56 readings
- 1986Cycle-aligned directional trend indicator
- 1987What crossover and directional entry rules actually compare
- 1988A directional-line cross needs a trend filter, an extreme-point rule, and a dollar stop
- 1988Constructing true range by offset addressing
- 1988Constructing directional movement from bar range
- 1988Average directional index construction: recursive smoothing and lookback offset
- 1988Staged Average Directional Index construction with Relative Strength Index confirmation and stop alerts
- 1988Average Directional Index construction with frozen true range and directional rules
- 1991Constructing the average directional index from range expansion and true range
- 1991Constructing five-session forecasts from stochastic, ADX, and MACD inputs
- 1993Constructing the average directional index from directional movement and true range
- 1993Confirming n-bar breakouts with ADX and DX filters
- 1994Constructing a Bollinger band-width trend filter
- 1994A pre-trade checklist that can refuse a long three ways
- 1997An ADX threshold and a moving average as a trend filter
- 1998Regime filters for mutated indicators
- 1999Building the average directional index from range extension and true range
- 2000Evaluating ADX, RSI, and moving averages in a multi-stock warehouse
- 2000Stochastic pop as a filtered continuation setup
- 2000Onset and exit from one average directional index
- 2002Joint ADX and MACD readout for trend strength and direction
- 2003Adaptive Donchian breakout with implied volatility and volume
- 2004The average directional index as a regime gate for the relative strength index and the stochastic oscillator
- 2004Constructing true-range-specified volume as a directional filter
- 2005Constructing a multi-filter penny stock breakout procedure
- 2005Construct one playbook that flips with session regime
- 2005Combining Bollinger Bands, the average directional index, and Fibonacci retracement on currency pairs
- 2006Assembling an adaptive price zone from double-smoothed averages
- 2006An ADX strength gate for MACD and the stochastic oscillator
- 2007Directional movement as a filter plus trigger
- 2007Constructing a veto-first trend permission stack
- 2007ADX gates for trend end, range, and reversal
- 2008Constructing a nine-cell directional-ratio grid
- 2008Average directional index and directional trend indicator lookbacks as trend-filter parameters
- 2008A holding-matched market lens from averages and directional-line crosses
- 2008A nine-cell directional scoreboard for multi-horizon entries
- 2010Building a Vortex Indicator from high-low distances
- 2010Constructing ADX, RSI, and MACD price filters
- 2011Constructing a volume zone oscillator with a moving-average and Average Directional Index regime filter
- 2011A volume zone oscillator conditioned by an Average Directional Index filter
- 2011Candlestick names need volume-price, ADX, and moving-average checks
- 2012Clustered average-directional-index traces as a trend-start filter
- 2012Average Directional Index cluster filters for trend-start signals
- 2012Confirming a trend start or turn with a triple ADX cluster
- 2013Constructing a late-entry stack from a signed DMI oscillator
- 2013A directional oscillator and its stochastic as a stacked timing filter
- 2013ADX cluster lookbacks are a locked specification, not a chart label
- 2013Combining moving averages, stochastics, and ADX in a daily scan
- 2015Assembling the Average Directional Index from directional movement
- 2016How an Average Directional Index filter and a breakout entry form one procedure
- 2016Score RSI and stochastic crossings only when ADX confirms the trend
- 2018Constructing an ADX filter for intraday breakouts
- 2018An ADX volatility gate for prior-day breakouts
- 2019Exponential deviation bands with a moving average, RSI and ADX
- 2020A normalized-slope trend filter from linear regression
- 2020Gating volatility-momentum divergences with a Trend filter