2008issue C101-4
A nine-cell directional scoreboard for multi-horizon entries
A three-by-three grid of short, intermediate, and long determinates is completed before any trigger is taken. Consecutive cells on the next wider horizon decide whether a matching shorter-horizon rule is treated as trend-aligned or handed to countertrend gates.
- Short, intermediate, and long cells are each marked up, down, or neutral from that horizon's high-low pattern, producing nine readings.
- A trigger is treated as trend-aligned only when the next wider interval shows two consecutive cells in the same direction.
- Direction is never taken from any interval shorter than 60 minutes, even when a trigger is taken on a five-minute chart.
- Without consecutive agreement, the scoreboard classifies the market as countertrend and requires a support or resistance location plus a price-momentum divergence.
The scoreboard comes first
The directional construction is a three-by-three grid whose short, intermediate, and long cells are each marked up, down, or neutral from that horizon's high-low pattern, producing nine readings. Each cell is a determinate: the up, down, or neutral reading for one defined horizon length. The completed three-by-three arrangement of determinates is the directional-ratio, used to classify a market as trend-aligned or countertrend before a trigger is taken.
In this workflow the average directional index is that nine-cell directional scoreboard. The scoreboard is built so longer-horizon and intermediate-horizon cells can be read together before an entry is placed on the short horizon.
EUR/JPY nine-cell directional scoreboard, 29 April 2008
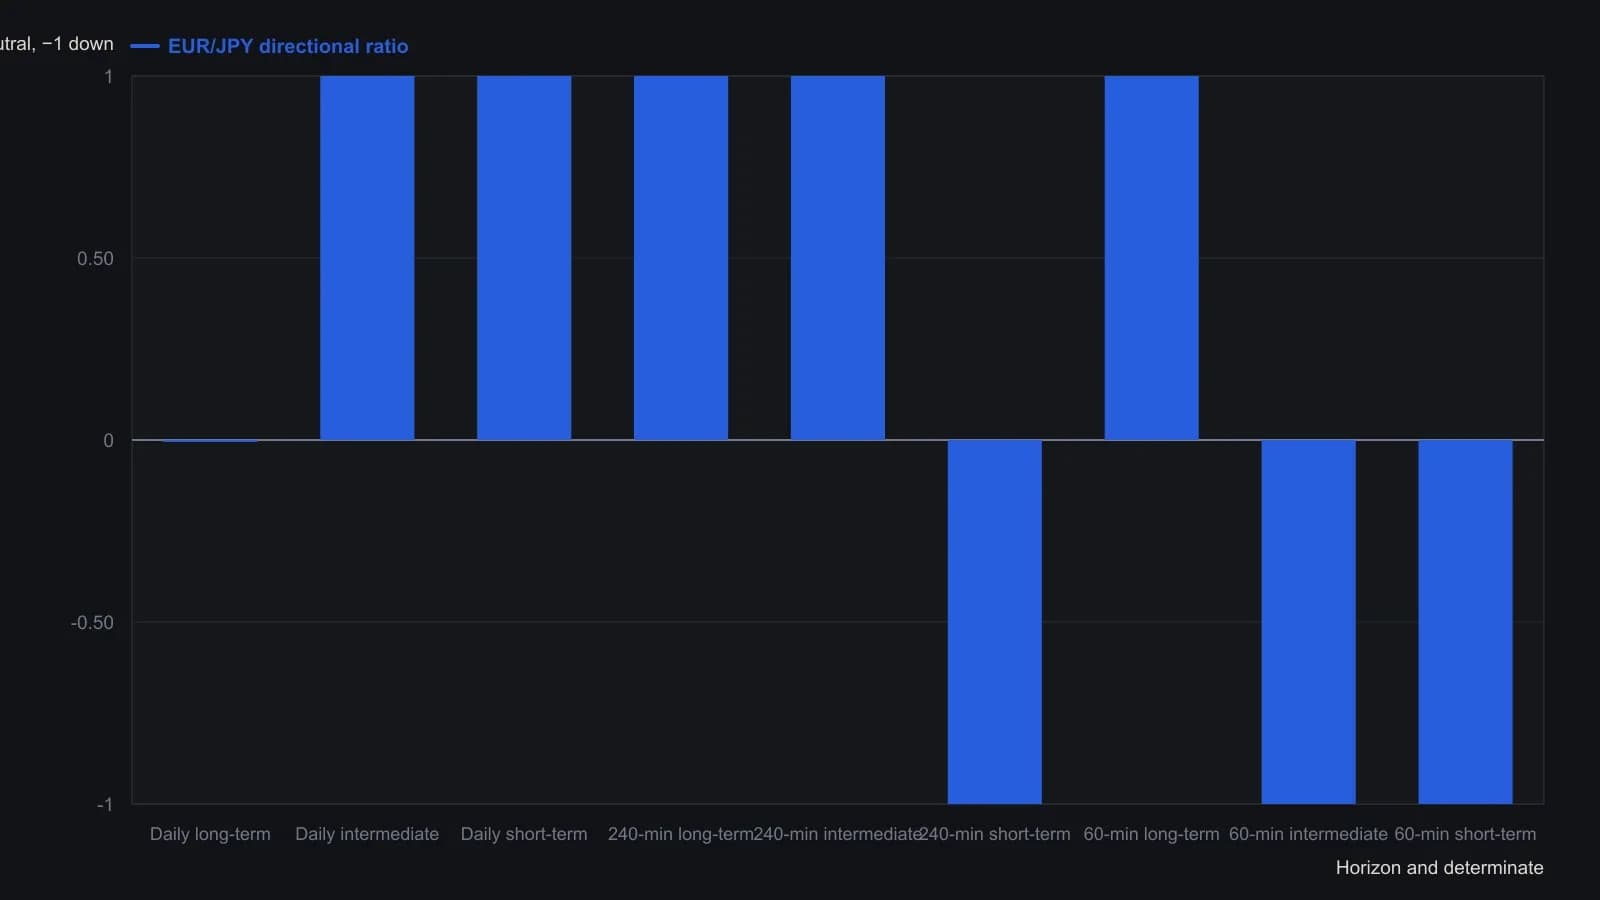
The printed table records only Up, Neutral, and Down. Those three states are mapped to +1, 0, and −1 so the nine cells can be plotted. No close series is taken from the candlestick screenshots because they carry no readable price scale.
How a trigger becomes trend-aligned
A trigger on one sampling interval is treated as trend-aligned only when the next wider interval shows two consecutive cells in the same direction. That pass condition is the trend filter.
Two consecutive 60-minute cells in one direction make a matching 15-minute trigger a trend entry. Two consecutive 240-minute cells make a matching 60-minute trigger a trend entry. Direction is never taken from any interval shorter than 60 minutes, even though a trigger may be taken on a five-minute chart.
The same trigger can be a trend entry on one horizon and a countertrend entry on a shorter horizon, depending on which cells are consecutive.
The trigger catalog and countertrend gates
The entry trigger itself is one of three rules: a five-and-five moving-average cross, a close through a doji high or low, or an inside bar at support or resistance.
When no adjacent horizons show the same consecutive direction, the scoreboard classifies the market as countertrend and the support-resistance-plus-divergence gates apply. A countertrend entry is allowed only when the trigger occurs at support or resistance and the trigger interval shows a divergence between price and a momentum measure.
A five-minute trigger still requires 60-minute directional agreement plus a same-direction turn in stochastic, MACD histogram, or RSI on the 15-minute interval. The rule-based entry is that fixed trigger catalog plus the extra location and momentum-divergence gates when the scoreboard does not show consecutive agreement.
All readings on this track · 56 readings
- 1986Cycle-aligned directional trend indicator
- 1987What crossover and directional entry rules actually compare
- 1988A directional-line cross needs a trend filter, an extreme-point rule, and a dollar stop
- 1988Constructing true range by offset addressing
- 1988Constructing directional movement from bar range
- 1988Average directional index construction: recursive smoothing and lookback offset
- 1988Staged Average Directional Index construction with Relative Strength Index confirmation and stop alerts
- 1988Average Directional Index construction with frozen true range and directional rules
- 1991Constructing the average directional index from range expansion and true range
- 1991Constructing five-session forecasts from stochastic, ADX, and MACD inputs
- 1993Constructing the average directional index from directional movement and true range
- 1993Confirming n-bar breakouts with ADX and DX filters
- 1994Constructing a Bollinger band-width trend filter
- 1994A pre-trade checklist that can refuse a long three ways
- 1997An ADX threshold and a moving average as a trend filter
- 1998Regime filters for mutated indicators
- 1999Building the average directional index from range extension and true range
- 2000Evaluating ADX, RSI, and moving averages in a multi-stock warehouse
- 2000Stochastic pop as a filtered continuation setup
- 2000Onset and exit from one average directional index
- 2002Joint ADX and MACD readout for trend strength and direction
- 2003Adaptive Donchian breakout with implied volatility and volume
- 2004The average directional index as a regime gate for the relative strength index and the stochastic oscillator
- 2004Constructing true-range-specified volume as a directional filter
- 2005Constructing a multi-filter penny stock breakout procedure
- 2005Construct one playbook that flips with session regime
- 2005Combining Bollinger Bands, the average directional index, and Fibonacci retracement on currency pairs
- 2006Assembling an adaptive price zone from double-smoothed averages
- 2006An ADX strength gate for MACD and the stochastic oscillator
- 2007Directional movement as a filter plus trigger
- 2007Constructing a veto-first trend permission stack
- 2007ADX gates for trend end, range, and reversal
- 2008Constructing a nine-cell directional-ratio grid
- 2008Average directional index and directional trend indicator lookbacks as trend-filter parameters
- 2008A holding-matched market lens from averages and directional-line crosses
- 2008A nine-cell directional scoreboard for multi-horizon entries
- 2010Building a Vortex Indicator from high-low distances
- 2010Constructing ADX, RSI, and MACD price filters
- 2011Constructing a volume zone oscillator with a moving-average and Average Directional Index regime filter
- 2011A volume zone oscillator conditioned by an Average Directional Index filter
- 2011Candlestick names need volume-price, ADX, and moving-average checks
- 2012Clustered average-directional-index traces as a trend-start filter
- 2012Average Directional Index cluster filters for trend-start signals
- 2012Confirming a trend start or turn with a triple ADX cluster
- 2013Constructing a late-entry stack from a signed DMI oscillator
- 2013A directional oscillator and its stochastic as a stacked timing filter
- 2013ADX cluster lookbacks are a locked specification, not a chart label
- 2013Combining moving averages, stochastics, and ADX in a daily scan
- 2015Assembling the Average Directional Index from directional movement
- 2016How an Average Directional Index filter and a breakout entry form one procedure
- 2016Score RSI and stochastic crossings only when ADX confirms the trend
- 2018Constructing an ADX filter for intraday breakouts
- 2018An ADX volatility gate for prior-day breakouts
- 2019Exponential deviation bands with a moving average, RSI and ADX
- 2020A normalized-slope trend filter from linear regression
- 2020Gating volatility-momentum divergences with a Trend filter