2007issue C011-5
Constructing a veto-first trend permission stack
A construction drill that starts with unmarked price and volume, skips unreadable swing structure, locks a repeatable trendline or average, and only then lets average directional index grant or deny trend-following permission.
- Start with unmarked price and volume, and add later tools only after the raw chart already looks promising.
- The described trend-following edge is the option to stand aside when a market will not show a readable direction.
- If swing structure is readable, lock a reproducible trendline or a moving average before later tools are added.
- Average directional index then measures how far directional movement has pulled apart and can grant or deny trend-following permission.
Begin with the unmarked chart
A construction sequence starts with unmarked price and volume and adds other tools only after the raw chart looks promising. The first job is to see whether the unmarked chart already looks like a market worth studying.
The described trend-following edge is the option to stand aside. If a market will not show a readable direction, the next step is to leave it rather than force a call.
Read swing structure first
From any chosen point, the first trend test is whether the market is making higher highs and higher lows or lower highs and lower lows. That swing structure is the sequence of successive highs and lows used to decide whether a market is advancing, declining, or going nowhere.
If the swing structure is unreadable, the market is skipped. Trend-following is treated as a procedure that joins an already readable directional market and treats standing aside as a valid outcome when direction is not obvious.
Lock a reproducible trendline or average
If the market is readable, the next construction step is to lock a reproducible trendline. An uptrend line is drawn from the lowest low to the highest minor low before the highest high without crossing intervening prices, then extended past that high. A downtrend line uses the mirror construction from the highest high to the lowest minor high before the lowest low. The same two swing pivots always produce the same line.
A moving average uses every close in its window, unlike a trendline that rests on a few touch points. It can be treated as a curved line whose break has the same meaning as a trendline break. In a simple 20-day average each close in the window counts equally, including the close 19 days back. An exponential moving average of the same length puts more weight on the latest prices.
Trend-tracking tools are described as confirming after the fact. A trend is a completed run of higher or lower swings and is not known to have ended until a contrary swing appears.
Grant or deny permission last
Positive directional movement above negative directional movement is treated as a bullish state and the reverse as bearish. Average directional index then measures and smooths that gap, rising as one side dominates and falling as the two sides converge. It is a smoothed 0 to 100 style reading of how far the two sides have pulled apart, used to rate trend presence rather than price direction.
Editorial reading: TradersWeek treats average directional index here as a trend filter, a quantitative gate that rates a lookback as trending or trendless before a directional system is allowed to act.
One filter waits for average directional index to lift from a low, preferably under 20, then turn up and cross the lower directional line. A moving average of that reading, used as a high-or-low band for trending versus trendless regimes, is treated as trending above the 20 to 25 area and below 20 as trendless. A reading already above 50 is treated as a late extreme.
In the illustrated daily example, average directional index falls below 20 during a June to July stretch described as trendless, then rises as price breaks out from late July into August.
Anheuser-Busch ADX (14) versus the 20 permission line
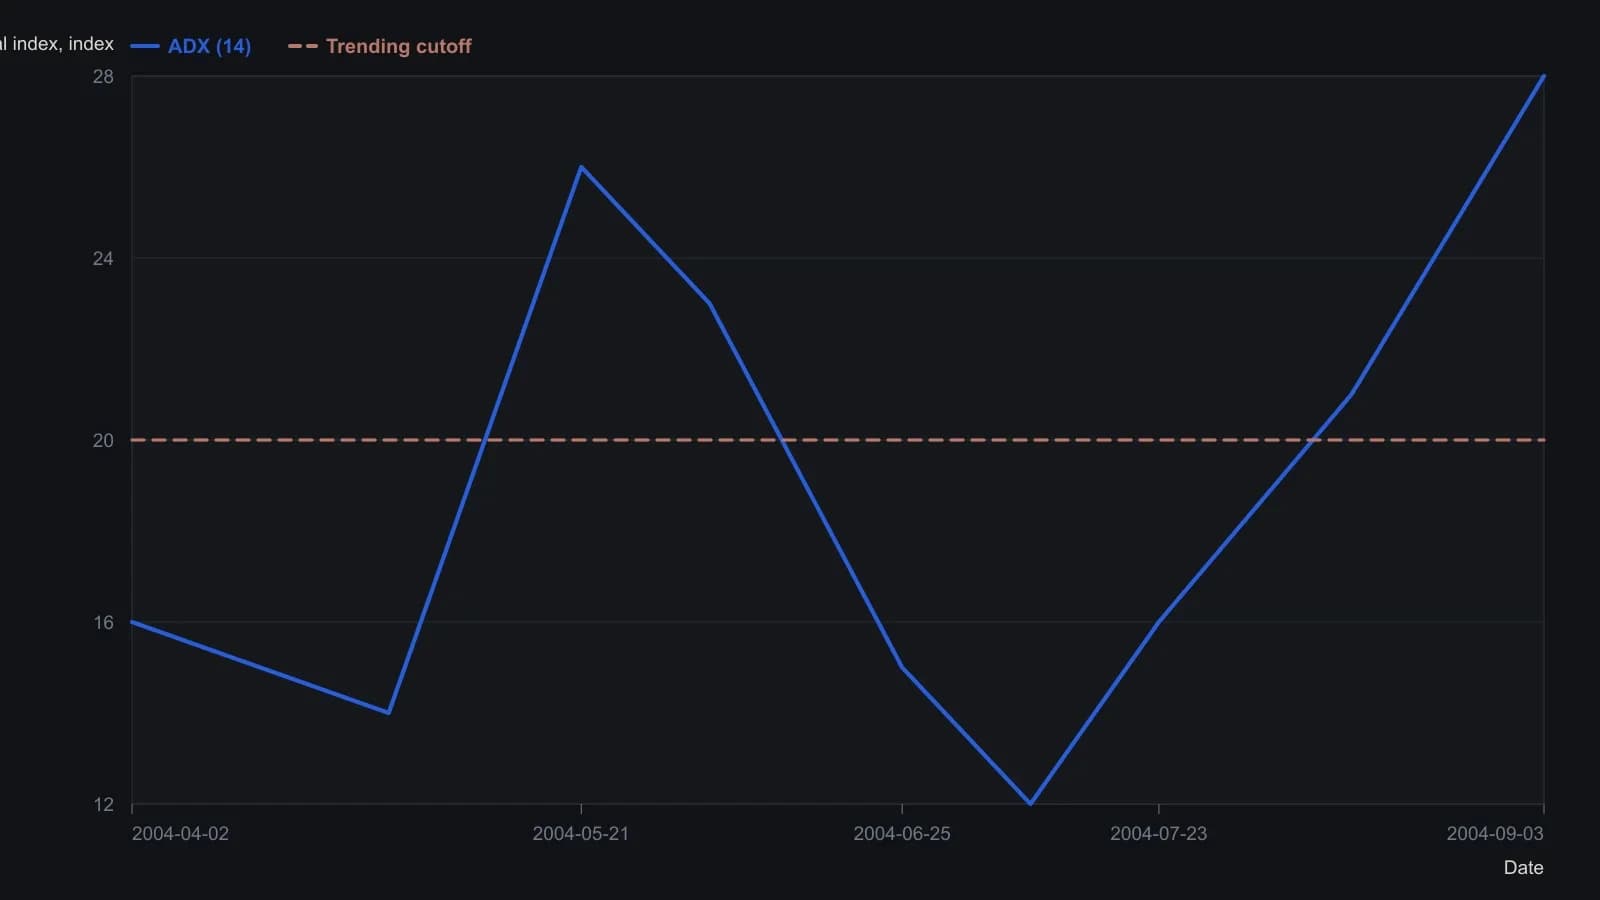
DMI period is 14, as labeled on the Prophet pane. Oscillator readings are approximate from a small printed scale and are given as whole-number turning points, not daily prints. The same sheet quotes a last price of 49.45.
All readings on this track · 56 readings
- 1986Cycle-aligned directional trend indicator
- 1987What crossover and directional entry rules actually compare
- 1988A directional-line cross needs a trend filter, an extreme-point rule, and a dollar stop
- 1988Constructing true range by offset addressing
- 1988Constructing directional movement from bar range
- 1988Average directional index construction: recursive smoothing and lookback offset
- 1988Staged Average Directional Index construction with Relative Strength Index confirmation and stop alerts
- 1988Average Directional Index construction with frozen true range and directional rules
- 1991Constructing the average directional index from range expansion and true range
- 1991Constructing five-session forecasts from stochastic, ADX, and MACD inputs
- 1993Constructing the average directional index from directional movement and true range
- 1993Confirming n-bar breakouts with ADX and DX filters
- 1994Constructing a Bollinger band-width trend filter
- 1994A pre-trade checklist that can refuse a long three ways
- 1997An ADX threshold and a moving average as a trend filter
- 1998Regime filters for mutated indicators
- 1999Building the average directional index from range extension and true range
- 2000Evaluating ADX, RSI, and moving averages in a multi-stock warehouse
- 2000Stochastic pop as a filtered continuation setup
- 2000Onset and exit from one average directional index
- 2002Joint ADX and MACD readout for trend strength and direction
- 2003Adaptive Donchian breakout with implied volatility and volume
- 2004The average directional index as a regime gate for the relative strength index and the stochastic oscillator
- 2004Constructing true-range-specified volume as a directional filter
- 2005Constructing a multi-filter penny stock breakout procedure
- 2005Construct one playbook that flips with session regime
- 2005Combining Bollinger Bands, the average directional index, and Fibonacci retracement on currency pairs
- 2006Assembling an adaptive price zone from double-smoothed averages
- 2006An ADX strength gate for MACD and the stochastic oscillator
- 2007Directional movement as a filter plus trigger
- 2007Constructing a veto-first trend permission stack
- 2007ADX gates for trend end, range, and reversal
- 2008Constructing a nine-cell directional-ratio grid
- 2008Average directional index and directional trend indicator lookbacks as trend-filter parameters
- 2008A holding-matched market lens from averages and directional-line crosses
- 2008A nine-cell directional scoreboard for multi-horizon entries
- 2010Building a Vortex Indicator from high-low distances
- 2010Constructing ADX, RSI, and MACD price filters
- 2011Constructing a volume zone oscillator with a moving-average and Average Directional Index regime filter
- 2011A volume zone oscillator conditioned by an Average Directional Index filter
- 2011Candlestick names need volume-price, ADX, and moving-average checks
- 2012Clustered average-directional-index traces as a trend-start filter
- 2012Average Directional Index cluster filters for trend-start signals
- 2012Confirming a trend start or turn with a triple ADX cluster
- 2013Constructing a late-entry stack from a signed DMI oscillator
- 2013A directional oscillator and its stochastic as a stacked timing filter
- 2013ADX cluster lookbacks are a locked specification, not a chart label
- 2013Combining moving averages, stochastics, and ADX in a daily scan
- 2015Assembling the Average Directional Index from directional movement
- 2016How an Average Directional Index filter and a breakout entry form one procedure
- 2016Score RSI and stochastic crossings only when ADX confirms the trend
- 2018Constructing an ADX filter for intraday breakouts
- 2018An ADX volatility gate for prior-day breakouts
- 2019Exponential deviation bands with a moving average, RSI and ADX
- 2020A normalized-slope trend filter from linear regression
- 2020Gating volatility-momentum divergences with a Trend filter