1991issue C031-6
Constructing the average directional index from range expansion and true range
The average directional index rates trend intensity from zero to one hundred so different markets can be compared on the same footing. High scores are paired with trend-following methods, low scores with range methods, and a plus-minus directional-indicator cross is applied only on high-scoring markets.
- The average directional index rates how one-sided recent range expansion has been on a shared zero-to-one-hundred scale, so different markets can be compared on the same footing.
- Each session keeps only the larger of the high-to-high or low-to-low increment as a positive quantity; an inside session contributes zero directional movement.
- Directional indicators are those increments expressed as a fraction of true range, first as fourteen-period sums and later as a smoothed moving sum that keeps thirteen-fourteenths of the prior total.
- A fourteen-period plus-minus directional-indicator cross is described as a directional rule applied only on high-scoring markets, after the average has already ranked trend intensity.
A score of one-sided movement
The average directional index rates trend intensity on a bounded scale from zero to one hundred so different markets can be compared on the same footing. After that rating, high scores are paired with trend-following methods and low scores with range methods.
The average directional index is a twice-smoothed, zero-to-one-hundred score of how intensely recent price movement has been one-sided rather than two-sided. The historical workflow builds that score from range expansion and true range.
One directional increment per session
Each session yields a single directional-movement value: the larger of the high-to-high increment or the low-to-low increment. Both increments are stored as positive numbers.
Plus directional movement is the upward range increment from comparing the current high with the prior high. It is kept only when it is larger than the downward increment. Minus directional movement is the downward range increment from comparing the current low with the prior low. It is labeled minus but stored as a positive quantity.
An outside session keeps the larger excursion beyond the prior range. An inside session is a bar whose high-low range lies inside or matches the prior bar and therefore contributes zero directional movement.
True range as the scale
The directional indicator is that bar’s directional movement expressed as a fraction of the same bar’s true range. True range is the largest of the current high-low span, the current high versus the prior close, and the current low versus the prior close.
Window sums and the smoothed moving sum
The original construction sums plus directional movement, minus directional movement, and true range over fourteen periods, then forms each directional indicator as the matching sum over the true-range sum. Another lookback may replace fourteen.
After the first window, each fourteen-period total is updated by multiplying the prior total by thirteen-fourteenths and adding the new raw observation. That update is a smoothed moving sum: a recursive lookback total that keeps thirteen-fourteenths of the previous window and adds the newest raw observation.
The directional movement index and its average
The directional movement index is the absolute difference of the two fourteen-period directional totals divided by their sum and placed on the zero-to-one-hundred scale. That step records the absolute imbalance between the two smoothed directional-movement totals, scaled by their sum.
The average directional index is the fourteen-period moving average of that index. Once fourteen average-directional-index readings exist, later readings are formed by multiplying the previous average by thirteen-fourteenths and adding the current directional-movement-index value.
When a plus-minus cross is allowed to speak
Illustrated cases associate a high average-directional-index reading with a strong trend and a low reading with a range that later rises when price begins to trend. A fourteen-period plus-minus directional-indicator cross is then described as a directional rule applied only on high-scoring markets.
Editorial reading: the intensity score is assembled first, and the plus-minus cross is considered only after a high score has already ranked the market as trending.
Microsoft ADX versus price, mid-1989 to early 1990
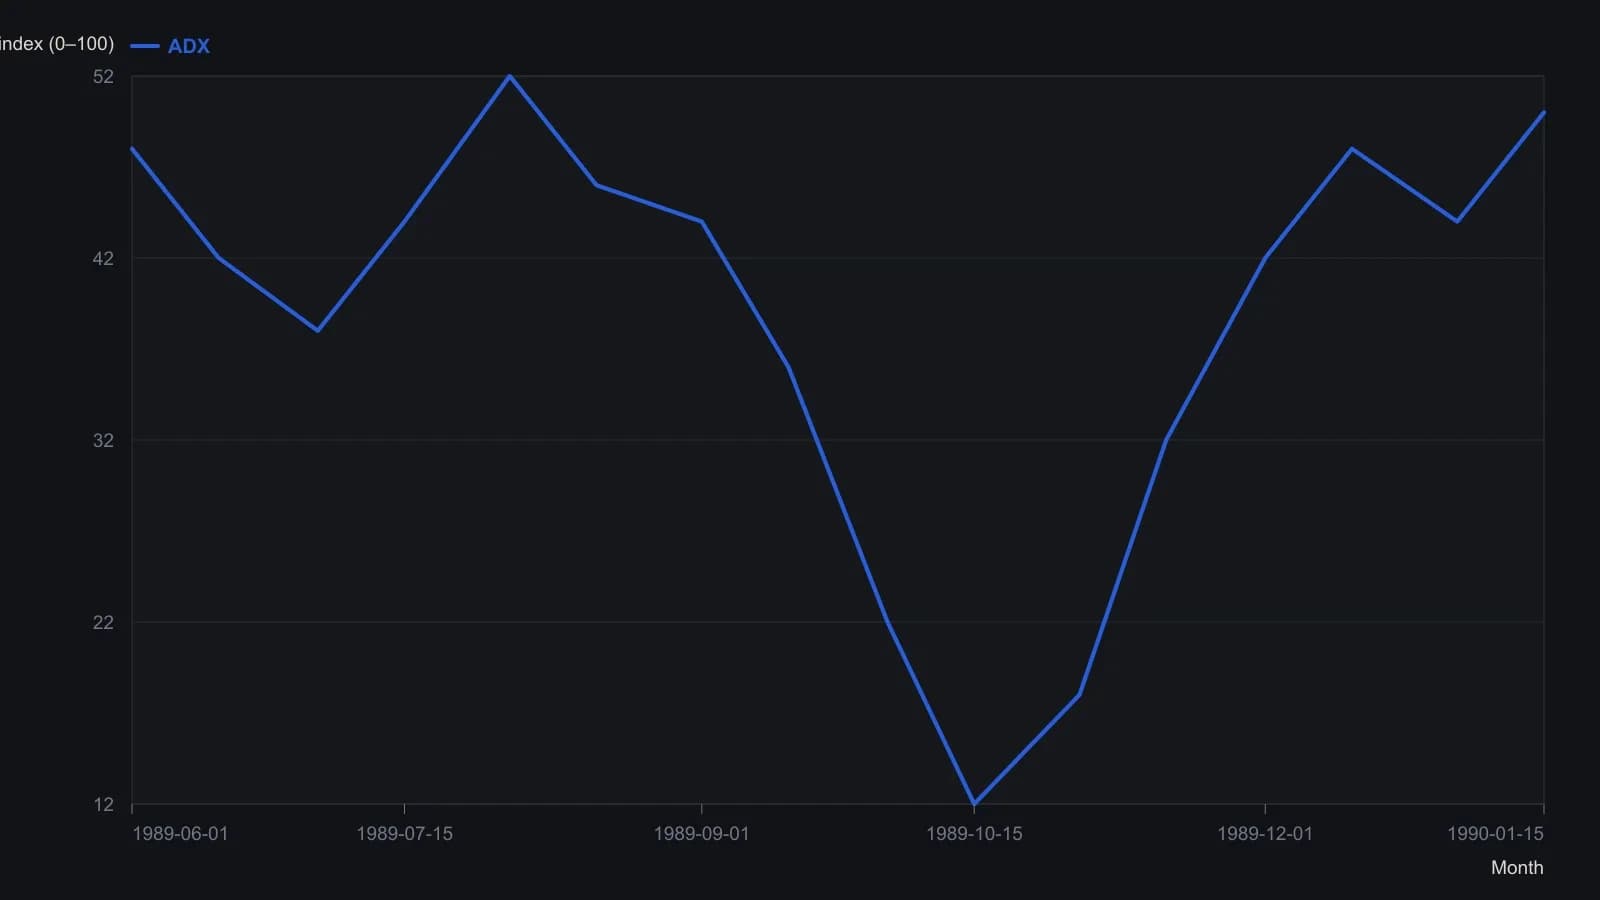
Approximate weekly readings from the printed chart; Wilder’s 14-period ADX on a 0–100 scale. No printed table exists, so points are visual estimates.
All readings on this track · 56 readings
- 1986Cycle-aligned directional trend indicator
- 1987What crossover and directional entry rules actually compare
- 1988A directional-line cross needs a trend filter, an extreme-point rule, and a dollar stop
- 1988Constructing true range by offset addressing
- 1988Constructing directional movement from bar range
- 1988Average directional index construction: recursive smoothing and lookback offset
- 1988Staged Average Directional Index construction with Relative Strength Index confirmation and stop alerts
- 1988Average Directional Index construction with frozen true range and directional rules
- 1991Constructing the average directional index from range expansion and true range
- 1991Constructing five-session forecasts from stochastic, ADX, and MACD inputs
- 1993Constructing the average directional index from directional movement and true range
- 1993Confirming n-bar breakouts with ADX and DX filters
- 1994Constructing a Bollinger band-width trend filter
- 1994A pre-trade checklist that can refuse a long three ways
- 1997An ADX threshold and a moving average as a trend filter
- 1998Regime filters for mutated indicators
- 1999Building the average directional index from range extension and true range
- 2000Evaluating ADX, RSI, and moving averages in a multi-stock warehouse
- 2000Stochastic pop as a filtered continuation setup
- 2000Onset and exit from one average directional index
- 2002Joint ADX and MACD readout for trend strength and direction
- 2003Adaptive Donchian breakout with implied volatility and volume
- 2004The average directional index as a regime gate for the relative strength index and the stochastic oscillator
- 2004Constructing true-range-specified volume as a directional filter
- 2005Constructing a multi-filter penny stock breakout procedure
- 2005Construct one playbook that flips with session regime
- 2005Combining Bollinger Bands, the average directional index, and Fibonacci retracement on currency pairs
- 2006Assembling an adaptive price zone from double-smoothed averages
- 2006An ADX strength gate for MACD and the stochastic oscillator
- 2007Directional movement as a filter plus trigger
- 2007Constructing a veto-first trend permission stack
- 2007ADX gates for trend end, range, and reversal
- 2008Constructing a nine-cell directional-ratio grid
- 2008Average directional index and directional trend indicator lookbacks as trend-filter parameters
- 2008A holding-matched market lens from averages and directional-line crosses
- 2008A nine-cell directional scoreboard for multi-horizon entries
- 2010Building a Vortex Indicator from high-low distances
- 2010Constructing ADX, RSI, and MACD price filters
- 2011Constructing a volume zone oscillator with a moving-average and Average Directional Index regime filter
- 2011A volume zone oscillator conditioned by an Average Directional Index filter
- 2011Candlestick names need volume-price, ADX, and moving-average checks
- 2012Clustered average-directional-index traces as a trend-start filter
- 2012Average Directional Index cluster filters for trend-start signals
- 2012Confirming a trend start or turn with a triple ADX cluster
- 2013Constructing a late-entry stack from a signed DMI oscillator
- 2013A directional oscillator and its stochastic as a stacked timing filter
- 2013ADX cluster lookbacks are a locked specification, not a chart label
- 2013Combining moving averages, stochastics, and ADX in a daily scan
- 2015Assembling the Average Directional Index from directional movement
- 2016How an Average Directional Index filter and a breakout entry form one procedure
- 2016Score RSI and stochastic crossings only when ADX confirms the trend
- 2018Constructing an ADX filter for intraday breakouts
- 2018An ADX volatility gate for prior-day breakouts
- 2019Exponential deviation bands with a moving average, RSI and ADX
- 2020A normalized-slope trend filter from linear regression
- 2020Gating volatility-momentum divergences with a Trend filter