2002issue C011-4
Joint ADX and MACD readout for trend strength and direction
The average directional index reports whether price has organized into a trend. Moving average convergence/divergence marks which way momentum is leaning. Read together, their geometry can be classified as a confirming, diverging, or consolidating pattern, with a short moving average used only to check that the oscillator still tracks price.
- The average directional index rises as price organizes into a trend and falls when price is sideways or loses trending power, but it does not state whether the trend is up or down.
- Moving average convergence/divergence can mark direction when it rises through its trigger line or falls through its zero line, so plotting it with the average directional index makes strength and direction jointly visible.
- The joint geometry is a confirming pattern when both lines rise with advancing price, a diverging pattern when strength rises while the oscillator falls, and a consolidating pattern when strength fades while the oscillator stays near or above zero.
- A short simple moving average is only a check on whether the oscillator is still tracking price. Both readouts register after a move has begun, so the combination is not designed to pinpoint tops and bottoms.
Two questions, not one line
Editorial framing: TradersWeek splits this workflow into two questions. Is a trend present, and which way is price leaning. The archive pairing answers those questions with different tools rather than with a single line.
The average directional index rises as price organizes into a recognizable trend and falls when price moves sideways or loses trending power. It does not state whether the trend is up or down. Values from 20 to 30 mark mild-to-moderate trending conditions, while values above 30 usually mark a strong trend.
Moving average convergence/divergence can mark direction when it rises through its trigger line or falls through its zero line. Plotting the oscillator with the average directional index makes strength and direction jointly visible.
AOL Time Warner ADX, March–August 2001
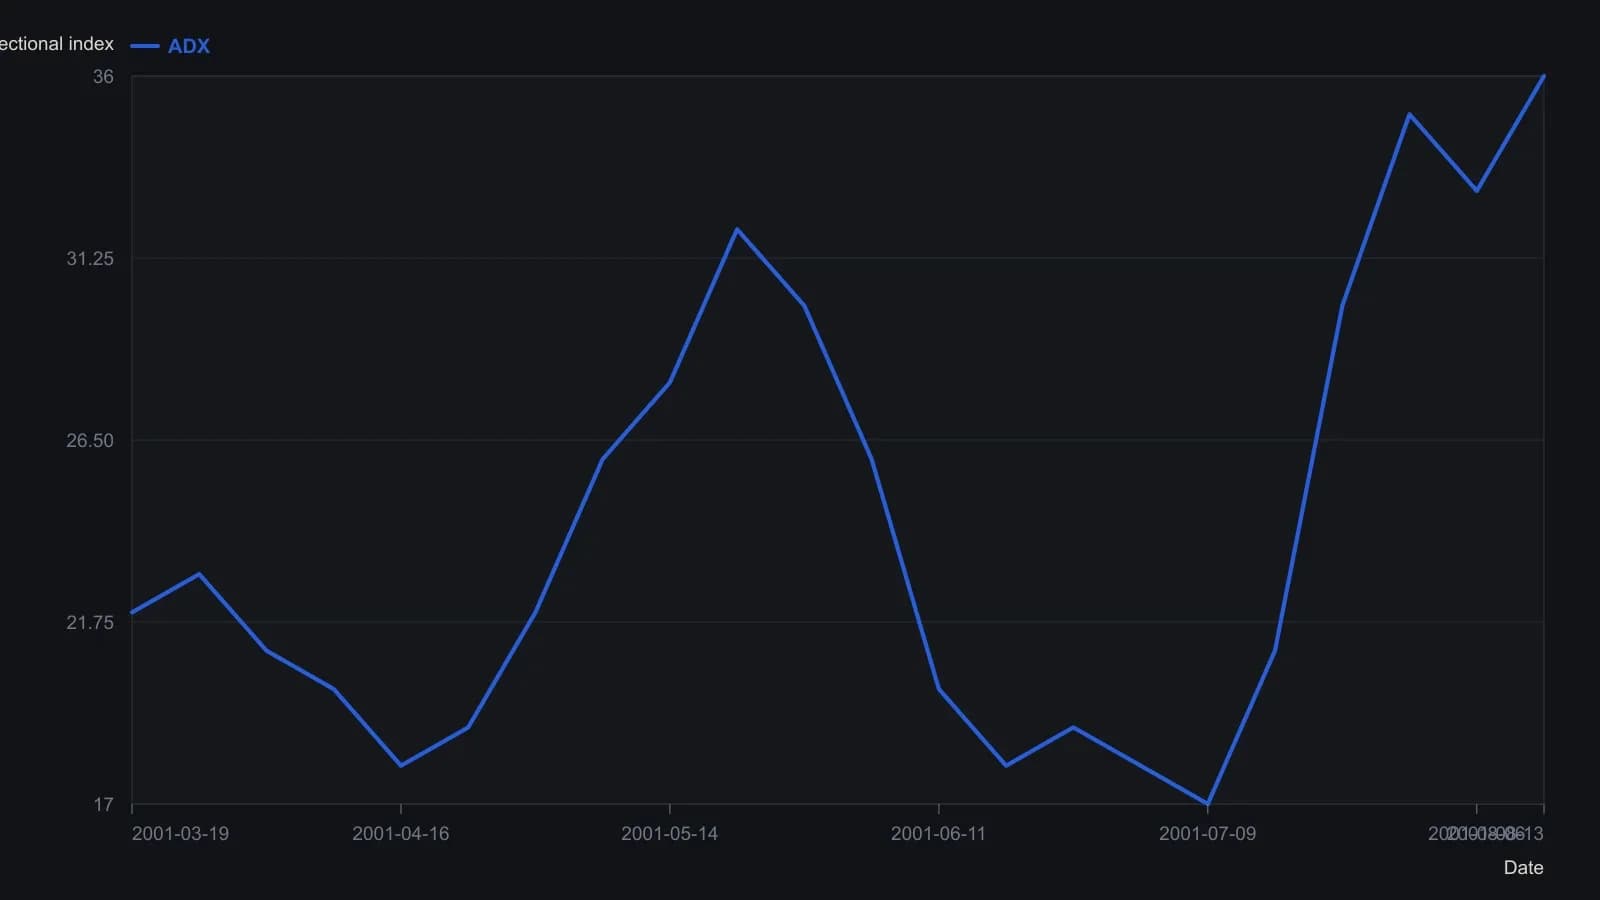
Sampled on the weekly dates labeled on the MetaStock x-axis and rounded to the nearest index point. MACD is omitted because it lives on a separate pane with a different scale.
Confirming, diverging, and consolidating geometry
When both indicators rise together they form a confirming pattern aligned with advancing price. A later drop in the average directional index means the detector no longer finds a trend, not that a downtrend has started. Both lines falling can also coincide with a sideways range.
A diverging pattern is a rising average directional index paired with the oscillator falling below its trigger line and often below the zero line. The two lines then form a near-mirror image during a downtrend. After a divergence, a turn from the lines moving apart to the lines moving toward each other is presented as a cue that a price shift may be approaching.
A consolidating pattern is a falling average directional index while the oscillator stays near or above the zero line, often after a confirming uptrend. That geometry can coincide with a trading-range pause before both lines rise again if the advance resumes.
A short moving average as a tracking check
A 13-unit simple moving average of price tends to correspond with the oscillator crossing its trigger line when the oscillator is tracking price. A later trigger-line cross higher can appear from fading downside momentum without a rising price or an upward-sloping average.
Editorial note: TradersWeek treats that short moving average only as a check on whether the momentum line is still tracking price, not as a third directional vote. Trigger-line crosses remain directional cues only when the oscillator is tracking price.
All readings on this track · 56 readings
- 1986Cycle-aligned directional trend indicator
- 1987What crossover and directional entry rules actually compare
- 1988A directional-line cross needs a trend filter, an extreme-point rule, and a dollar stop
- 1988Constructing true range by offset addressing
- 1988Constructing directional movement from bar range
- 1988Average directional index construction: recursive smoothing and lookback offset
- 1988Staged Average Directional Index construction with Relative Strength Index confirmation and stop alerts
- 1988Average Directional Index construction with frozen true range and directional rules
- 1991Constructing the average directional index from range expansion and true range
- 1991Constructing five-session forecasts from stochastic, ADX, and MACD inputs
- 1993Constructing the average directional index from directional movement and true range
- 1993Confirming n-bar breakouts with ADX and DX filters
- 1994Constructing a Bollinger band-width trend filter
- 1994A pre-trade checklist that can refuse a long three ways
- 1997An ADX threshold and a moving average as a trend filter
- 1998Regime filters for mutated indicators
- 1999Building the average directional index from range extension and true range
- 2000Evaluating ADX, RSI, and moving averages in a multi-stock warehouse
- 2000Stochastic pop as a filtered continuation setup
- 2000Onset and exit from one average directional index
- 2002Joint ADX and MACD readout for trend strength and direction
- 2003Adaptive Donchian breakout with implied volatility and volume
- 2004The average directional index as a regime gate for the relative strength index and the stochastic oscillator
- 2004Constructing true-range-specified volume as a directional filter
- 2005Constructing a multi-filter penny stock breakout procedure
- 2005Construct one playbook that flips with session regime
- 2005Combining Bollinger Bands, the average directional index, and Fibonacci retracement on currency pairs
- 2006Assembling an adaptive price zone from double-smoothed averages
- 2006An ADX strength gate for MACD and the stochastic oscillator
- 2007Directional movement as a filter plus trigger
- 2007Constructing a veto-first trend permission stack
- 2007ADX gates for trend end, range, and reversal
- 2008Constructing a nine-cell directional-ratio grid
- 2008Average directional index and directional trend indicator lookbacks as trend-filter parameters
- 2008A holding-matched market lens from averages and directional-line crosses
- 2008A nine-cell directional scoreboard for multi-horizon entries
- 2010Building a Vortex Indicator from high-low distances
- 2010Constructing ADX, RSI, and MACD price filters
- 2011Constructing a volume zone oscillator with a moving-average and Average Directional Index regime filter
- 2011A volume zone oscillator conditioned by an Average Directional Index filter
- 2011Candlestick names need volume-price, ADX, and moving-average checks
- 2012Clustered average-directional-index traces as a trend-start filter
- 2012Average Directional Index cluster filters for trend-start signals
- 2012Confirming a trend start or turn with a triple ADX cluster
- 2013Constructing a late-entry stack from a signed DMI oscillator
- 2013A directional oscillator and its stochastic as a stacked timing filter
- 2013ADX cluster lookbacks are a locked specification, not a chart label
- 2013Combining moving averages, stochastics, and ADX in a daily scan
- 2015Assembling the Average Directional Index from directional movement
- 2016How an Average Directional Index filter and a breakout entry form one procedure
- 2016Score RSI and stochastic crossings only when ADX confirms the trend
- 2018Constructing an ADX filter for intraday breakouts
- 2018An ADX volatility gate for prior-day breakouts
- 2019Exponential deviation bands with a moving average, RSI and ADX
- 2020A normalized-slope trend filter from linear regression
- 2020Gating volatility-momentum divergences with a Trend filter