1997issue C091-2
An ADX threshold and a moving average as a trend filter
A combination overlay can plot a 50-bar moving average of a chosen price series and alert when a 14-period Average Directional Index falls below 15. A companion screen reports signed days since the last 50-day cross and signed distance from that average, and a mechanical trend filter can require both side-of-average location and an Average Directional Index greater than 15.
- A combination overlay can plot a 50-bar moving average of a chosen price series and raise visual and audio alerts when a 14-period Average Directional Index falls below 15.
- A screen can count signed sessions since the close last crossed a 50-day average and state signed distance from that average as a percentage of the largest distance observed since the last cross.
- An Average Directional Index below 15 can be treated as low directional movement, while a mechanical trend filter can require both a close on the matching side of a 50-period average and an Average Directional Index greater than 15 before labeling a condition as trend-aligned.
- A triangle-style compression check can compare the last two peaks and last two valleys on a 5% zigzag of highs and lows, then be reviewed against the Average Directional Index and 50-day average statistics.
A slow average and an ADX cutoff
The historical workflow pairs a moving average used as a 50-bar or 50-day price baseline with an Average Directional Index used as a 14-period directional-movement reading compared with a stated low-level threshold. The moving average is used for side-of-market location, days since the last cross, and distance from the close. The Average Directional Index is then used to tell quiet directional movement from a more established reading.
The overlay and the companion pane
A combination overlay can plot a 50-bar moving average of a chosen price series and raise visual and audio alerts when a 14-period Average Directional Index falls below a level of 15. A companion Average Directional Index pane can show the 14-period reading as a histogram against a horizontal line at 15 and alert when that reading is below the line.
S&P 500 daily ADX and the 15 cutoff
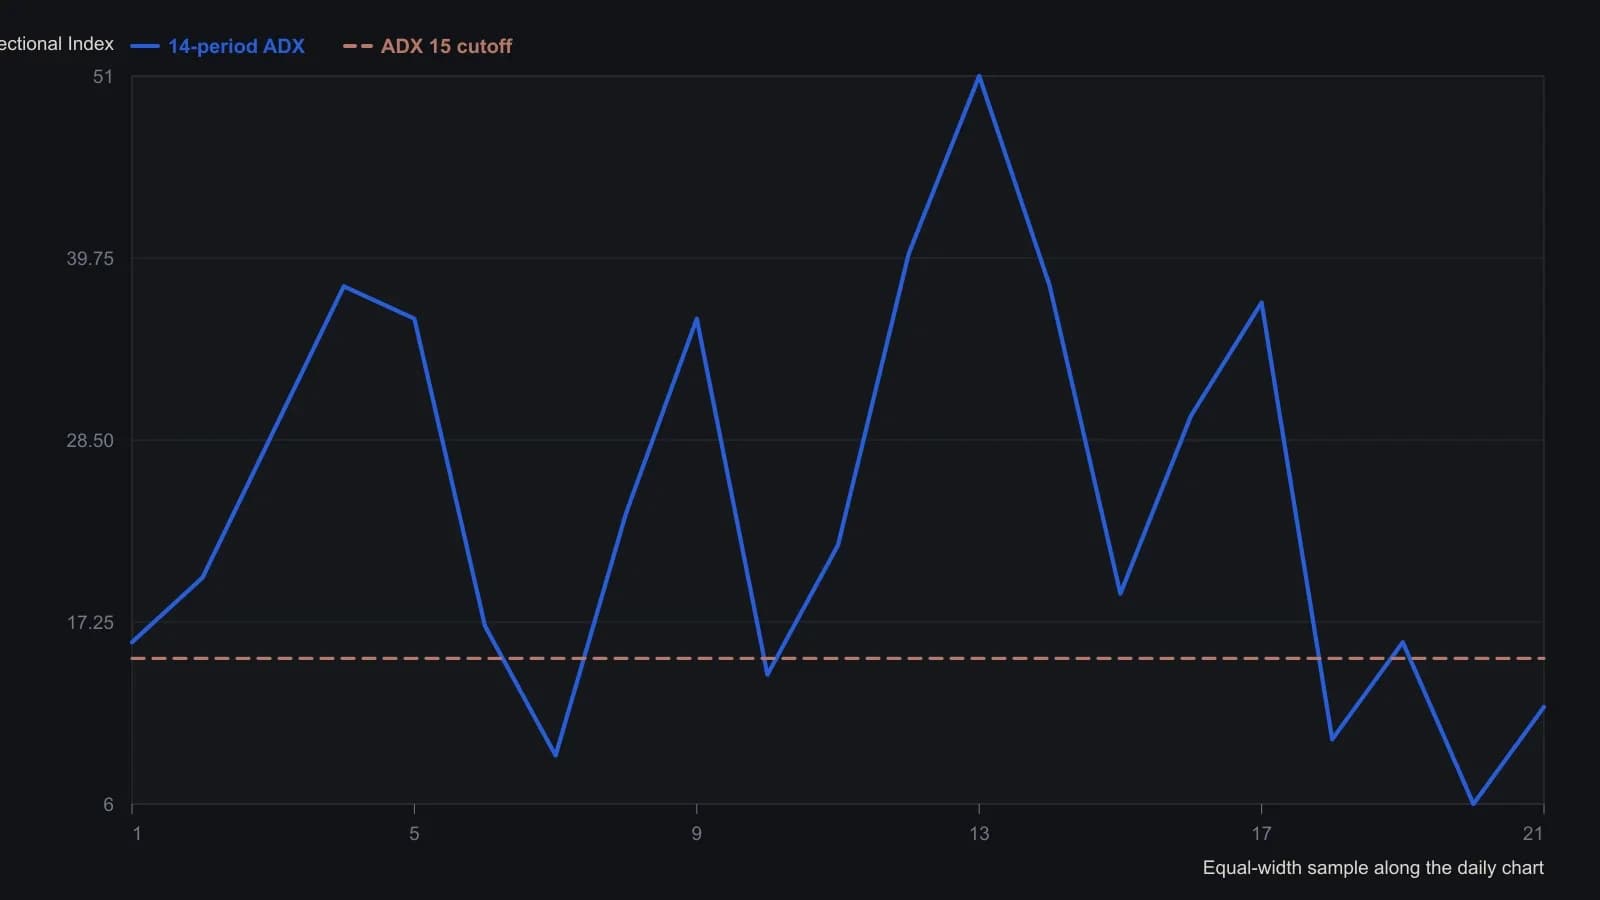
The tip does not print an ADX table, so each height is an approximate visual reading to the nearest index point. The 50-bar average sits in the price pane of the same figure and cannot share this axis.
Days since the last cross and distance from the average
A screen can count sessions since the close last crossed a 50-day average, using a negative sign when the close is below the average and a positive sign when it is above. The same screen can state how far the close sits from the 50-day average as a percentage of the largest distance observed since that last cross, again signed by whether price is above or below the average.
A shrinking magnitude of that percentage reading can be read as the close approaching the average. A larger magnitude in the days-since-cross column can be read as a longer-running alignment.
Quiet directional movement and a mechanical trend filter
An Average Directional Index reading below 15 can be treated as a low-directional-movement condition when judging whether a developing chart formation is occurring in a quiet trend environment. A mechanical trend filter can require both a close on the matching side of a 50-period average and an Average Directional Index greater than 15 before labeling an upside or downside condition as trend-aligned. That trend filter combines the average’s location of price with an Average Directional Index test for quiet versus established directional movement.
A triangle-style compression check
A triangle-style compression check can compare the last two peaks and last two valleys on a 5% zigzag of highs and lows, then be reviewed against the Average Directional Index and 50-day average statistics. Editorial: the compression check is a formation review, not a substitute for the average’s location of the close or for the Average Directional Index test of whether directional movement is quiet or established.
All readings on this track · 56 readings
- 1986Cycle-aligned directional trend indicator
- 1987What crossover and directional entry rules actually compare
- 1988A directional-line cross needs a trend filter, an extreme-point rule, and a dollar stop
- 1988Constructing true range by offset addressing
- 1988Constructing directional movement from bar range
- 1988Average directional index construction: recursive smoothing and lookback offset
- 1988Staged Average Directional Index construction with Relative Strength Index confirmation and stop alerts
- 1988Average Directional Index construction with frozen true range and directional rules
- 1991Constructing the average directional index from range expansion and true range
- 1991Constructing five-session forecasts from stochastic, ADX, and MACD inputs
- 1993Constructing the average directional index from directional movement and true range
- 1993Confirming n-bar breakouts with ADX and DX filters
- 1994Constructing a Bollinger band-width trend filter
- 1994A pre-trade checklist that can refuse a long three ways
- 1997An ADX threshold and a moving average as a trend filter
- 1998Regime filters for mutated indicators
- 1999Building the average directional index from range extension and true range
- 2000Evaluating ADX, RSI, and moving averages in a multi-stock warehouse
- 2000Stochastic pop as a filtered continuation setup
- 2000Onset and exit from one average directional index
- 2002Joint ADX and MACD readout for trend strength and direction
- 2003Adaptive Donchian breakout with implied volatility and volume
- 2004The average directional index as a regime gate for the relative strength index and the stochastic oscillator
- 2004Constructing true-range-specified volume as a directional filter
- 2005Constructing a multi-filter penny stock breakout procedure
- 2005Construct one playbook that flips with session regime
- 2005Combining Bollinger Bands, the average directional index, and Fibonacci retracement on currency pairs
- 2006Assembling an adaptive price zone from double-smoothed averages
- 2006An ADX strength gate for MACD and the stochastic oscillator
- 2007Directional movement as a filter plus trigger
- 2007Constructing a veto-first trend permission stack
- 2007ADX gates for trend end, range, and reversal
- 2008Constructing a nine-cell directional-ratio grid
- 2008Average directional index and directional trend indicator lookbacks as trend-filter parameters
- 2008A holding-matched market lens from averages and directional-line crosses
- 2008A nine-cell directional scoreboard for multi-horizon entries
- 2010Building a Vortex Indicator from high-low distances
- 2010Constructing ADX, RSI, and MACD price filters
- 2011Constructing a volume zone oscillator with a moving-average and Average Directional Index regime filter
- 2011A volume zone oscillator conditioned by an Average Directional Index filter
- 2011Candlestick names need volume-price, ADX, and moving-average checks
- 2012Clustered average-directional-index traces as a trend-start filter
- 2012Average Directional Index cluster filters for trend-start signals
- 2012Confirming a trend start or turn with a triple ADX cluster
- 2013Constructing a late-entry stack from a signed DMI oscillator
- 2013A directional oscillator and its stochastic as a stacked timing filter
- 2013ADX cluster lookbacks are a locked specification, not a chart label
- 2013Combining moving averages, stochastics, and ADX in a daily scan
- 2015Assembling the Average Directional Index from directional movement
- 2016How an Average Directional Index filter and a breakout entry form one procedure
- 2016Score RSI and stochastic crossings only when ADX confirms the trend
- 2018Constructing an ADX filter for intraday breakouts
- 2018An ADX volatility gate for prior-day breakouts
- 2019Exponential deviation bands with a moving average, RSI and ADX
- 2020A normalized-slope trend filter from linear regression
- 2020Gating volatility-momentum divergences with a Trend filter