2008issue C071-3
Average directional index and directional trend indicator lookbacks as trend-filter parameters
The average directional index occupies a 0-to-100 scale and reports whether a trend is present and how strong it is, not the direction of that trend. The documented default stack is a 14-period exponential average of the directional index, a 9-period smoothing step, and a 20-period directional trend indicator interval.
- The average directional index occupies a 0-to-100 scale and reports whether a trend is present and how strong it is, not the direction of that trend.
- A directional trend indicator cross is treated as incomplete unless the average directional index is rising, sitting above both directional lines, and not moving sideways.
- The documented default lookback stack is a 14-period exponential average of the directional index, a 9-period smoothing step, and a 20-period directional trend indicator interval.
- Cutting those lookbacks toward zero speeds both measures and raises the frequency of false breaks; raising the same periods delays early detection and makes the accepted trend-filter reading stronger once it appears.
What the average directional index reports
The average directional index occupies a 0-to-100 scale and is specified to report whether a trend is present and how strong it is, not the direction of that trend.
Readings above 25 are treated as a forming trend, while readings below 25 are treated as a range-bound or congested market that still needs a later trendline break as extra confirmation.
Used as a trend filter, the average directional index accepts a move after smoothed directional strength confirms and rejects a sideways reading as a false break.
Occupancy and the exhaustion band
A historical occupancy rule states that trends are present about 30 percent of the time and that markets are range-bound about 70 percent of the time.
Ordinary trends that appear in the low 20s are described as exhausting in the high 40s to 50s. That upper zone is the exhaustion band of the 0-to-100 scale. The 80-to-100 band is described as a rare extreme that news, month-end positioning, or shock events can still produce.
The documented lookback stack
The documented default stack is a 14-period exponential average of the directional index, a 9-period smoothing step, and a 20-period directional trend indicator interval. Those three periods form the lookback stack that sets response speed against false breaks.
Cutting those lookbacks toward zero speeds both the average directional index and the directional trend indicator and is also described as raising the frequency of false breaks.
Raising the same periods is described as delaying early detection while making the accepted trend-filter reading stronger once it appears.
When a directional trend indicator cross is complete
A directional trend indicator cross is treated as incomplete unless the average directional index is rising, sitting above both directional lines, and not moving sideways, because a flat average directional index is classified as a false break rather than a trend.
Congestion associated with weak average directional index readings is described as lasting as long as 12 to 14 days, with new trends expected to emerge from the teens to the low 20s.
A lagging hourly confirmation
In the hourly chart example, the average directional index did not confirm the advance until after the formal directional trend indicator cross and only about halfway through the move, which is used to illustrate the pair as a lagging trend-filter.
Hourly GBP/USD average directional index, 19 September–4 October 2007
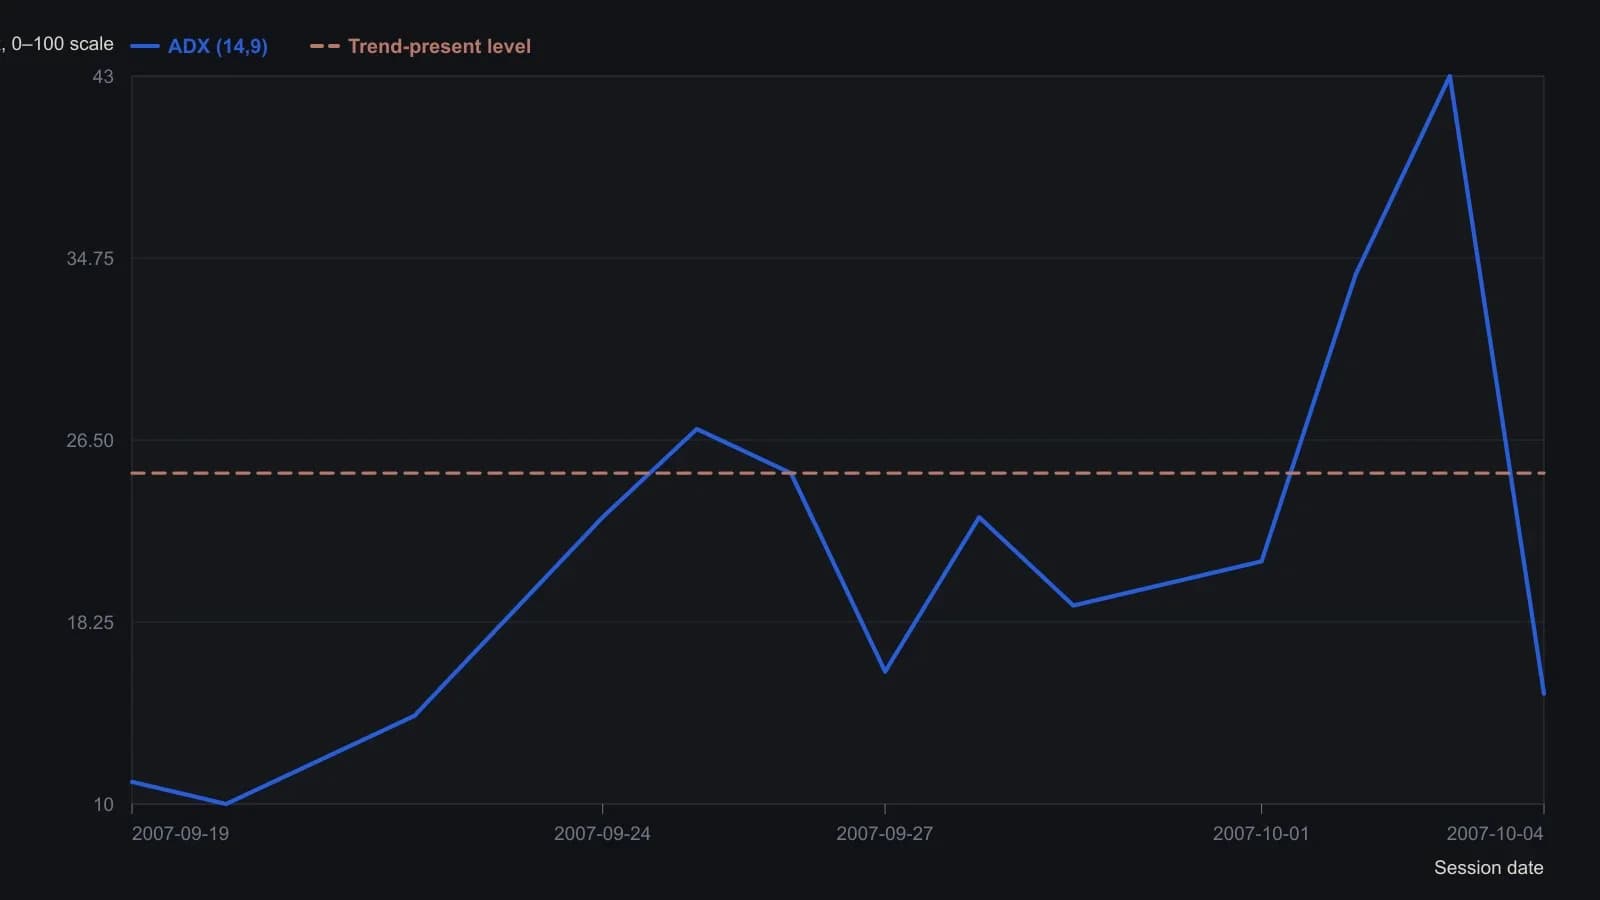
Pane scaled 0–50 from the figure’s top tick of 50; the last print 15.2458 sits where the curve ends. Intermediate points are visual reads to the nearest point at the figure’s dated ticks, not tick data. Plus/minus DI (interval 20) appear on the same figure but overlap too tightly to place the 26 September cross without guessing, so they are omitted.
All readings on this track · 56 readings
- 1986Cycle-aligned directional trend indicator
- 1987What crossover and directional entry rules actually compare
- 1988A directional-line cross needs a trend filter, an extreme-point rule, and a dollar stop
- 1988Constructing true range by offset addressing
- 1988Constructing directional movement from bar range
- 1988Average directional index construction: recursive smoothing and lookback offset
- 1988Staged Average Directional Index construction with Relative Strength Index confirmation and stop alerts
- 1988Average Directional Index construction with frozen true range and directional rules
- 1991Constructing the average directional index from range expansion and true range
- 1991Constructing five-session forecasts from stochastic, ADX, and MACD inputs
- 1993Constructing the average directional index from directional movement and true range
- 1993Confirming n-bar breakouts with ADX and DX filters
- 1994Constructing a Bollinger band-width trend filter
- 1994A pre-trade checklist that can refuse a long three ways
- 1997An ADX threshold and a moving average as a trend filter
- 1998Regime filters for mutated indicators
- 1999Building the average directional index from range extension and true range
- 2000Evaluating ADX, RSI, and moving averages in a multi-stock warehouse
- 2000Stochastic pop as a filtered continuation setup
- 2000Onset and exit from one average directional index
- 2002Joint ADX and MACD readout for trend strength and direction
- 2003Adaptive Donchian breakout with implied volatility and volume
- 2004The average directional index as a regime gate for the relative strength index and the stochastic oscillator
- 2004Constructing true-range-specified volume as a directional filter
- 2005Constructing a multi-filter penny stock breakout procedure
- 2005Construct one playbook that flips with session regime
- 2005Combining Bollinger Bands, the average directional index, and Fibonacci retracement on currency pairs
- 2006Assembling an adaptive price zone from double-smoothed averages
- 2006An ADX strength gate for MACD and the stochastic oscillator
- 2007Directional movement as a filter plus trigger
- 2007Constructing a veto-first trend permission stack
- 2007ADX gates for trend end, range, and reversal
- 2008Constructing a nine-cell directional-ratio grid
- 2008Average directional index and directional trend indicator lookbacks as trend-filter parameters
- 2008A holding-matched market lens from averages and directional-line crosses
- 2008A nine-cell directional scoreboard for multi-horizon entries
- 2010Building a Vortex Indicator from high-low distances
- 2010Constructing ADX, RSI, and MACD price filters
- 2011Constructing a volume zone oscillator with a moving-average and Average Directional Index regime filter
- 2011A volume zone oscillator conditioned by an Average Directional Index filter
- 2011Candlestick names need volume-price, ADX, and moving-average checks
- 2012Clustered average-directional-index traces as a trend-start filter
- 2012Average Directional Index cluster filters for trend-start signals
- 2012Confirming a trend start or turn with a triple ADX cluster
- 2013Constructing a late-entry stack from a signed DMI oscillator
- 2013A directional oscillator and its stochastic as a stacked timing filter
- 2013ADX cluster lookbacks are a locked specification, not a chart label
- 2013Combining moving averages, stochastics, and ADX in a daily scan
- 2015Assembling the Average Directional Index from directional movement
- 2016How an Average Directional Index filter and a breakout entry form one procedure
- 2016Score RSI and stochastic crossings only when ADX confirms the trend
- 2018Constructing an ADX filter for intraday breakouts
- 2018An ADX volatility gate for prior-day breakouts
- 2019Exponential deviation bands with a moving average, RSI and ADX
- 2020A normalized-slope trend filter from linear regression
- 2020Gating volatility-momentum divergences with a Trend filter