1989issue C041-5
Constructing an open-interest-scaled put-call ratio
A put-call reading is built by scaling each side of the options book by its own open interest, keeping bull-intensity and bear-intensity visible as separate series, then reading one-sided extremes, inverted-sentiment-trend slope, and price-ratio divergence as a weeks-to-months regime overlay.
- A raw put-call volume comparison is treated as a distorted sentiment gauge because each side is more informative when it is measured against the open interest attached to it.
- Bull-intensity and bear-intensity stay visible as separate series before they are combined into an open-interest-adjusted-ratio.
- A weekly-equivalence-scale multiplies daily index-option volume by five so daily and weekly single-name series can share one scale.
- One-sided extremes, inverted-sentiment-trend slope, and divergence are read as a weeks-to-months regime overlay rather than as a raw tape count.
Measure each side against its own open interest
A raw put-call volume comparison is treated as a distorted sentiment gauge because option activity is more informative when each side is measured against the open interest attached to it. Open-interest-analysis scales current put or call volume by the matching open-interest book so the reading reflects turnover intensity, not just which side printed more contracts.
Keep bull-intensity and bear-intensity visible
Bull-intensity is constructed as call volume divided by call open interest, isolating how hard the bullish side of the options argument is turning over. Bear-intensity is constructed as put volume divided by put open interest, isolating how hard the bearish side of the options argument is turning over. Each side of the argument can then be read on its own.
Restate the put-call-ratio after scaling
Combining those sides produces bear-intensity divided by bull-intensity, which is the open-interest-adjusted-ratio. That construction restates the put-call-ratio after adjusting for the relative size of each open-interest book. The put-call-ratio then compares put activity with call activity so the balance of the two sides can be read as a market-regime overlay rather than a raw tape count.
Use one weekly-equivalence-scale
Daily index-option put and call volume is multiplied by five so daily series and weekly single-name series can be compared on one weekly-equivalence-scale.
Place call-side data in the numerator for a trend overlay
When the series is built as a trend overlay rather than an extreme oscillator, call-side data is placed in the numerator so the line travels with price and direction changes are easier to mark. That inverted-sentiment-trend is the same construction with call-side data in the numerator. Intact uptrends were associated with a declining path, or a rising path if the ratio is inverted.
Historical extreme bands
Two-day weekly-equivalent totals were assigned historical extreme bands of 500 or more before 1987 and 350 or more afterward for bottom-area readings, versus 140 or less before 1987 and 200 or less afterward for top-area readings. Single-day readings near 300 were mapped to important bottom areas, while readings near 250 were placed two to four weeks before a final low and again near that low. Persistently high daily readings of 150 or more were described as preceding important market weakness by two to five weeks.
Weekly conditions on individual names
On individual names, weekly readings of 300 or more were treated as bottom-area conditions, readings of 60 to 70 or less as top-area conditions, and readings of 50 or less lasting two to three weeks as blow-off-top conditions.
Compare the ratio path with price
Ten-week and 34-week ratio windows were compared with a broad equity index through April 1988. Ratio-versus-price divergences in early 1983, mid-1985, early 1986, and late 1987 were cited as preceding later declines or sideways stretches. Divergence is a chart condition in which the open-interest-scaled sentiment series fails to confirm a price high or low, framing a later weakness, pause, or turn as a testable hypothesis.
Hines 10-week and 33-week ratios versus the S&P 500, 1983–1988
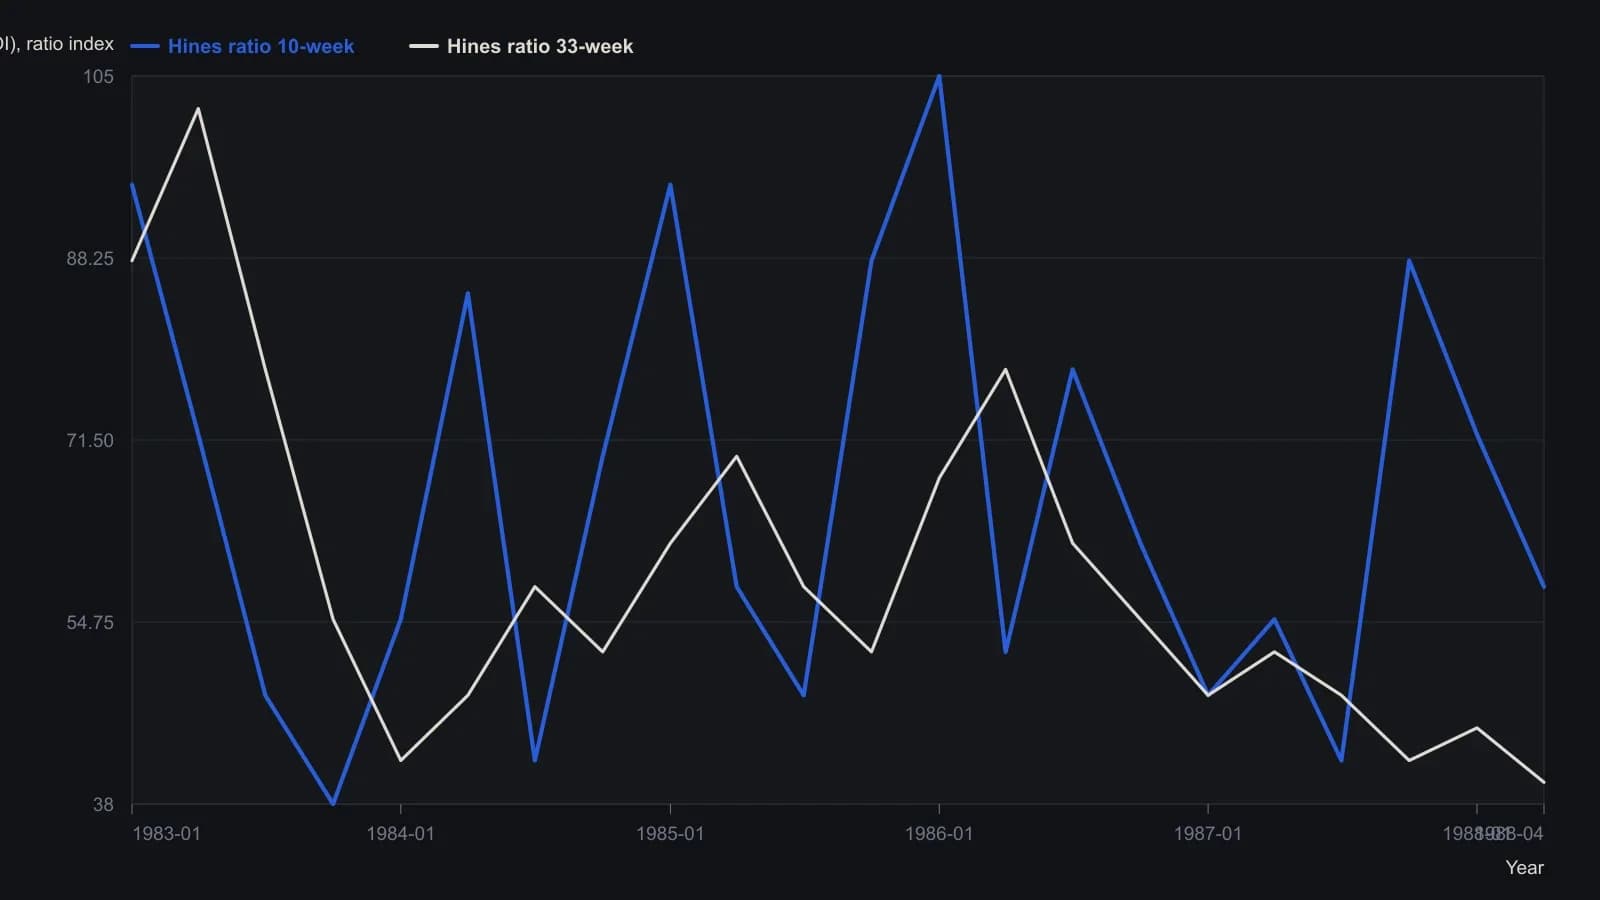
Values read off the printed Figure 1 raster (CBOE weekly, through April 1988). Axis ticks are coarse; points are approximate and are not a table extract. The source also writes 34-week in one sentence and 33-week on the figure.
All readings on this track · 31 readings
- 1989Constructing an open-interest-scaled put-call ratio
- 1990Open-interest put/call ratio as an intermediate sentiment overlay
- 1990Activity-weighted call-put ratio for options regime context
- 1990Stacking moving averages, put-call regimes, and double bottoms
- 1991Constructing put-call open-interest regime filters
- 1991Constructing an activity-weighted call-put sentiment reading
- 1991Fund-index regime, put-call confirmation, then the tracking fund
- 1992A seven-vote sentiment score for fund-sleeve regimes
- 1992Construct an activity-weighted call-put ratio before reading crowd conviction
- 1992Pair action with opinion in a composite sentiment index
- 1992Crowd extremes as a three-gate contrary procedure
- 1993Constructing a put-volume average regime filter
- 1993Neural-net inputs and rule trees for mechanical systems
- 1994Failed Treasury put-call signal and a dollar regime shift
- 1994Separate survey, put-call, and premium ledgers before a regime call
- 1994Repeated option-premium prints and a four-zone regime map
- 1995Consecutive-day regimes in the put-call premium ratio
- 1995Construct a put-call ratio for regime-aware contrarian signals
- 1996Treat one options idea as a regime-aware portfolio decision
- 1997Options open interest, put-call sentiment, and contrarian context
- 2000A two-layer put-call construction for intermediate market conditions
- 2002Sentiment confirmation for trend-following options
- 2003Construct a regime overlay from implied volatility and the put-call ratio
- 2004Dollar-weighted Put-call ratio construction
- 2006Debit put spreads inside put-call regimes
- 2011Put-call ratio cycle phases for index context
- 2011Constructing a put-call ratio cycle indicator
- 2011Building a put-call ratio indicator stack
- 2011Put-call ratio regime context with oscillator and band confirmation
- 2018Reading seasonal regimes with put-call divergence and bands
- 2020Treat close-only volume as a hypothesis, then choose regime or phase