1999issue C101-7
A trend filter that switches tactics and scales ATR targets
A 14-period Average Directional Index on end-of-day data was treated as a coarse momentum gauge. The same reading chose trend or range tactics and then helped set a movable Average True Range profit objective.
- A 14-period Average Directional Index on end-of-day data was treated as a coarse momentum gauge, with readings near 15 to 20 called weak and readings above 30 called stronger.
- When the Average Directional Index was above 30, or below 30 and still rising, the same plan dropped range tools and judged the market by its relation to a long moving-average series.
- When the Average Directional Index sat below 30 and was flat or falling, the plan treated price as losing momentum and switched to range tactics with bands and a 14-period relative-strength oscillator.
- The Average Directional Index did not itself trigger an exit. Its level helped set an Average True Range profit objective from one range to 12 ranges, and that target could be raised if daily ranges expanded after entry.
A coarse momentum gauge
A 14-period Average Directional Index on end-of-day data was treated as a coarse momentum gauge. Readings near 15 to 20 were called weak. Readings above 30 were called stronger.
That reading was the Trend filter for one plan. It first chose whether the plan would follow a trend or treat price as a range. It later used the same level to help set an Average True Range profit objective.
When the plan follows the trend
When the Average Directional Index was above 30, or below 30 and still rising, the same plan dropped range tools and judged the market by its relation to a long moving-average series.
A high Average Directional Index on the chosen timeframe was read as a strong trend. The further claim was that a later reaction often retested an extreme, because momentum was expected to precede price.
A rising Average Directional Index in the 35 to 50 zone was used to stay with a strong move rather than take an early profit when price had already advanced about 25 percent in 30 days.
When the plan uses range tactics
When the Average Directional Index sat below 30 and was flat or falling, the same plan treated price as losing momentum. It switched to range tactics with bands and a 14-period relative-strength oscillator.
How the same reading sets an ATR target
The Average Directional Index did not itself trigger an exit. Its level instead helped set an Average True Range profit objective that could be as small as one range or as large as 12 ranges.
Editorial note: TradersWeek records that objective under ATR position sizing. The archive described a movable profit target, not a separate account-equity rule.
In one described stock-index system, a midrange Average Directional Index of 15 to 30 used a four-range profit objective, while very low or very high readings used a one-range objective.
The Average True Range target was treated as movable after entry. Expanding daily ranges could raise the number of ranges held for, rather than lock the original objective.
A preferred breakout setup
A long price base that drove the Average Directional Index to low levels was described as a preferred setup for a later breakout entry once the indicator began to rise.
14-period ADX on June 1999 crude oil
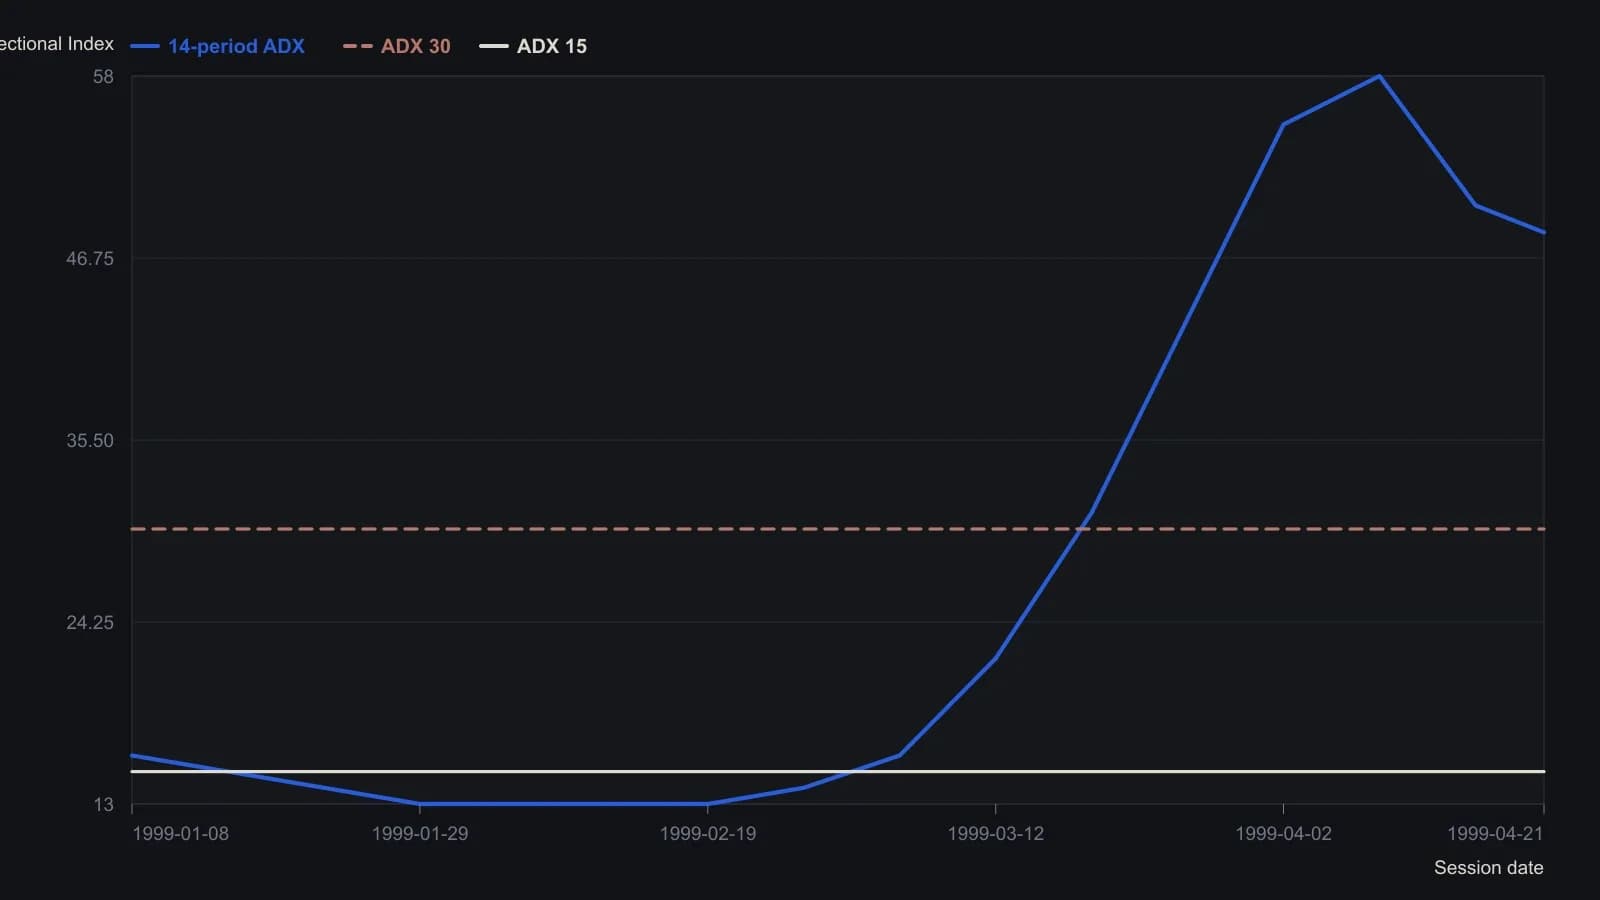
Points other than the labeled 48.33 close were read from the 0–60 ADX scale on the daily TradeStation pane and rounded to the nearest index point. Sampling is roughly weekly so the raster is not over-read. Lookback is the 14-period default on end-of-day bars.
All readings on this track · 36 readings
- 1988Constructing unsigned true range for directional models
- 1989Evaluate an always-in ATR breakout as one procedure
- 1992Variable lookback and average true range as a trend-filter construction
- 1993A random-walk index that uses true range as its scale
- 1993A shared harness for trend-filter construction
- 1998Finish a trend with a volatility trail, wave permission, and a slower-frame veto
- 1999A trend filter that switches tactics and scales ATR targets
- 2001Filter higher lows with linear regression, then judge the exit
- 2003A Mechanical trading system is a maintained procedure, not only an entry trigger
- 2005Construction of a volatility-bounded long entry
- 2005Six-zone encoding of open, high, low, and close
- 2006Normalized average true range as a pre-entry volatility bound
- 2006Chandelier exits, ATR position sizing, and trailing stops
- 2007Constructing a rule-based entry with Relative Strength Index and ATR position sizing
- 2008Constructing a zero-lag TMA and heikin-ashi crossover as a complete rule set
- 2010Use the session-range percent stop as a pre-trade filter
- 2011OCA exit groups, trailing limits, and ATR stops
- 2011ATR bands around support and resistance for stops and targets
- 2013Algorithmic head-and-shoulders construction with bounded exits
- 2013Constructing ATR-scaled swing pivots and linear-regression divergence
- 2013Constructing volatility bands from typical price
- 2014Constructing true-range contraction filters before expansion
- 2015Constructing touch plans from modified true range
- 2015One checklist for breakout entry and ATR risk
- 2015Percentage true-range construction for cross-market volatility filters
- 2015Construct a percentage true range for cross-market volatility
- 2015Percentage true range as a pre-entry exposure filter
- 2016Constructing ATR-filtered breakout entries
- 2017A dividend date as a pairs-trading classroom
- 2018Range-based volatility as a true-range construction
- 2018Moving average support and volatility-band construction
- 2018Construct a lifecycle breakout from compression
- 2018Pair the book first and let volatility or range set the size
- 2019Trend systems need a no-trade rule
- 2020Average true range as a shared unit for size, pairs, and stops
- 2020Volatility sizing and target-risk leverage as a pre-trade gate