2006issue C121-3
A trend-regime matrix for volatility position sizing
A market-versus-stock trend grid yields nine cells that assign long-trade exit and sizing stances. After that pairing locks an aggressive, neutral, or conservative equity slice, volatility position sizing sets share count from account equity, current volatility, stop distance, and allowed exposure.
- A trend filter labels the broad market and the individual name as up, down, or sideways before a money-management stance is chosen.
- The nine-cell money-management matrix only hints at trailing, targeting, split-exit, and sizing stances. It does not select the final strategy.
- Volatility position sizing then sets share count from account equity, current volatility, stop distance, and allowed exposure so a single loss or book-level risk stays bounded.
- Average directional index or moving-average slope can grade each axis as strong, neutral, or weak without replacing the first up, down, or sideways label.
A pre-entry order of operations
The historical workflow asks for a trend label on the broad market and a trend label on the individual name before any share count is computed. A trend filter supplies those labels from a lookback on ordered prices.
The two labels select a cell on a money-management matrix. That cell hints at an exit family and at an aggressive, neutral, or conservative equity slice. Volatility position sizing then turns the locked slice into a share count from account equity, current volatility, stop distance, and allowed exposure so a single loss or book-level risk stays bounded before entry and while the trade is open.
Nine cells for long trades
A market-versus-stock trend grid with up, sideways, and down on each axis yields nine regime cells that assign different exit and position-sizing stances for long trades. For short trades the same nine-cell mapping is inverted.
One stated trend-filter implementation treats the broad market as trending when the 20-day and 50-day simple moving averages point the same way, and as sideways when those averages are not aligned.
The matrix is described as a hint toward a money-management direction, not a rule that selects the final strategy.
Exit and size stances
In aligned or mixed-up long regimes, the framework points to trailing volatility stops built from historical volatility or average true range, more aggressive anti-martingale sizing, and optional pyramiding when both trends are up. Anti-martingale sizing raises size after favorable trend alignment rather than after losses, still inside a pre-set equity-risk band.
In down-biased long regimes, the framework points to earlier profit-taking and conservative size. When both market and stock trends are down, it points to a profit-target-only exit.
When market and stock trends are mixed or both sideways, the long-trade hint is to harvest half the position against initial risk or a resistance area, trail the remainder, and keep size neutral.
Equity risk and the separate exposure bound
The simplified equity-risk illustration is 1.5 percent when aggressive, 1 percent when neutral, and 0.5 percent when conservative, while noting that total exposure still requires a separate bound.
Current volatility, diversification, and overall exposure are listed as inputs that should change money-management parameters before a trade is treated as a business decision.
Strength grades and the inverted short map
Average Directional Index or moving-average slope can be added so each axis is graded strong, neutral, or weak rather than only up, down, or sideways. Average directional index is a trend-strength overlay. It does not replace the first trend-filter label.
For short trades the same nine-cell mapping is inverted, so the exit family and the equity-slice stance flip with the regime rather than being invented as a second system.
Equity risk by trend-regime sizing stance
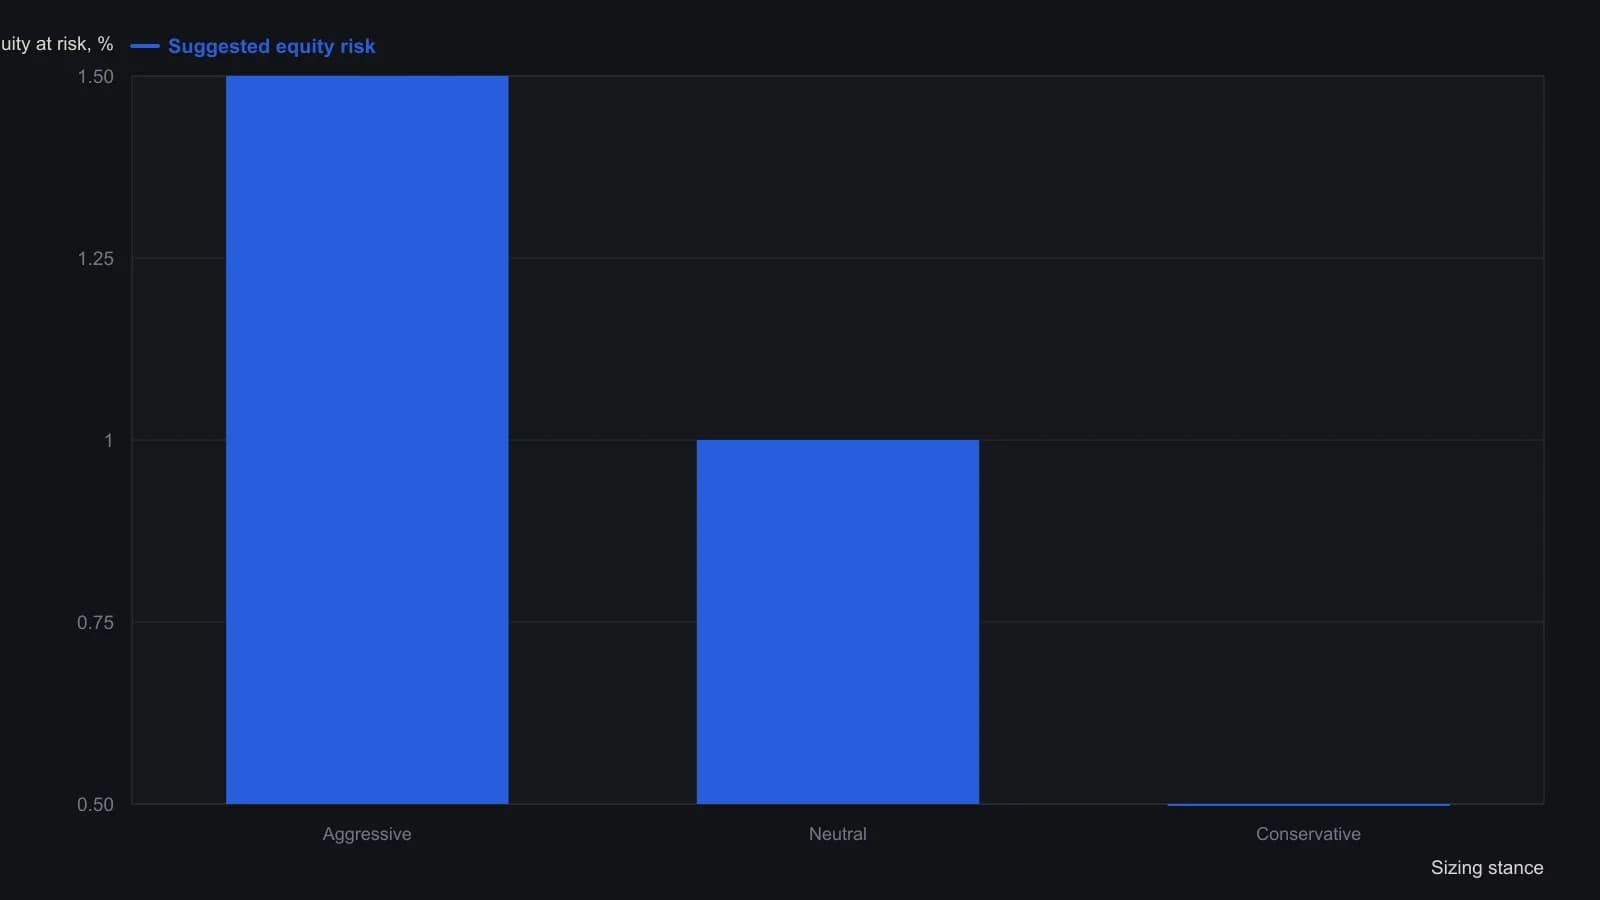
The source presents these three percentages as a simplified illustration and says total portfolio exposure still needs a separate bound.
All readings on this track · 25 readings
- 1988Two-sided optimization for volatility-scaled breakout rules
- 1990Weekly range volatility as a tactical regime filter
- 1993Heat first, then contract count on a weekly close-only breakout
- 1994Shared sigma for trend entries, retests and stops
- 1995The promised result as one testable trading procedure
- 2001Convert a survival ceiling into a volatility filter
- 2002Bound the next loss before the bear trade
- 2004Dollar-loss tolerance versus percent-of-equity stops
- 2004Bounded risk before entry: stop, size, and leverage
- 2006Position sizing as the pre-trade bound on loss and exposure
- 2006A trend-regime matrix for volatility position sizing
- 2011A premarket range checklist for opening-hour breakouts
- 2011Stop-defined share count on a clustered intraday short
- 2012Mechanical system design with strategy, signals, and size
- 2012Precommit size before a one-day policy shock
- 2013R-multiple expectancy, drawdown, and volatility position sizing
- 2014Constructing trend-aware slope-divergence rules
- 2014Pretrade drawdown fences and volatility sizing
- 2015Convert pip value into cash before a forex lot size is chosen
- 2016Expectancy as an execution skill rather than a backtest score
- 2017Volatility parity equalizes the ticket; implied volatility is a regime dial
- 2018Wide-range breakout rules from chart volatility
- 2019A structure-based stop, then resize or pass
- 2020A cash rule that zeros a trend book on extreme volatility and a short losing window
- 2025R-multiples before you size up