2013issue C1210-17
Yield spreads as country-specific equity regime context
A two-maturity government yield spread can travel as a portable market-regime label. Before that label colors a long-horizon equity read, it still has to pass local flattening bands, transmission lags, and commodity or funding idiosyncrasies.
- A yield spread, the long-maturity government yield minus the short-maturity government yield, is used as a flexible slope proxy because a strict all-rising or all-falling definition is often unusable.
- The five-country review used a one-year/10-year core maturity pair, or a two-year/10-year pair where one-year official yields were unpublished, then read local flattening bands rather than a single inversion switch.
- A flat-curve band between 0 and 0.5 can stand in as a flattening substitute where a fully negative curve rarely forms, but flattening alone was not treated as an entry or exit timer.
- The curve-equity link is an indirect regime gauge. Negative curves can coexist with rising equities, and commodity or policy lags can delay the local response.
A flexible proxy for curve slope
A strict all-rising or all-falling definition of curve slope is often unusable. Outer maturities can break the pattern, and identical yields across all tenors are almost never observed. A yield spread, the long-maturity government yield minus the short-maturity government yield, is therefore used as a flexible numeric stand-in for overall curve slope.
Editorial reading: a humped curve, with depressed short and long yields and a distinctly higher intermediate sector, is one uncommon shape that can spoil a whole-curve slope label even when a two-maturity pair still has a clear sign.
How a positive or negative curve is labelled
The three-month/10-year government spread is formed by subtracting the three-month yield from the 10-year yield. A result above zero is labelled a positive curve and treated as upward-sloping even when the far wings of the curve are imperfect. A result below zero is labelled a negative curve and treated as inverted even when not every maturity is falling.
A five-country core maturity pair
The five-country review used official central-bank yields for the United States, the United Kingdom, Germany, Canada, and Australia. The core maturity pair was the one-year and 10-year yields in the first three markets. Canada and Australia used the two-year and 10-year pair because one-year official yields were unpublished.
Local lags in the United States, Canada, and Germany
In the United States, the one-year/10-year spread stayed negative for multi-year stretches in the late 1960s, the 1970s, and the early 1980s. It turned negative again in 1989 before a 1990 equity pullback, fell close to -0.5% in spring 2000, and became negative again in early 2006.
Canada's two-year/10-year spread was already negative in 2007, yet the local equity index printed a new high in 2008 before declining. That gap was treated as a long and commodity-linked lag between a curve signal and the equity response.
In Germany, the one-year/10-year spread moved below 0.5 in 2000 and 2007. Those flattenings coincided with major equity downturns in a market where a fully negative curve was hard to form.
The flat-curve band as a substitute
Across the five countries, historical readings between 0 and 0.5 on the one-year/10-year or two-year/10-year spread were treated as a flat-curve band. A flat curve was described as able to stand in for a negative curve when inversion is scarce. That flattening substitute is a near-zero warning proxy in markets where a fully negative curve rarely forms.
Australia's two-year/10-year spread hovered near zero through 2005 and 2006 and only later turned negative. The equity index remained above its 200-day simple moving average for much of mid-2003 to mid-2007, so flattening alone was not treated as an entry or exit timer.
German 1-year/10-year yield spread versus the 0.5 flattening band
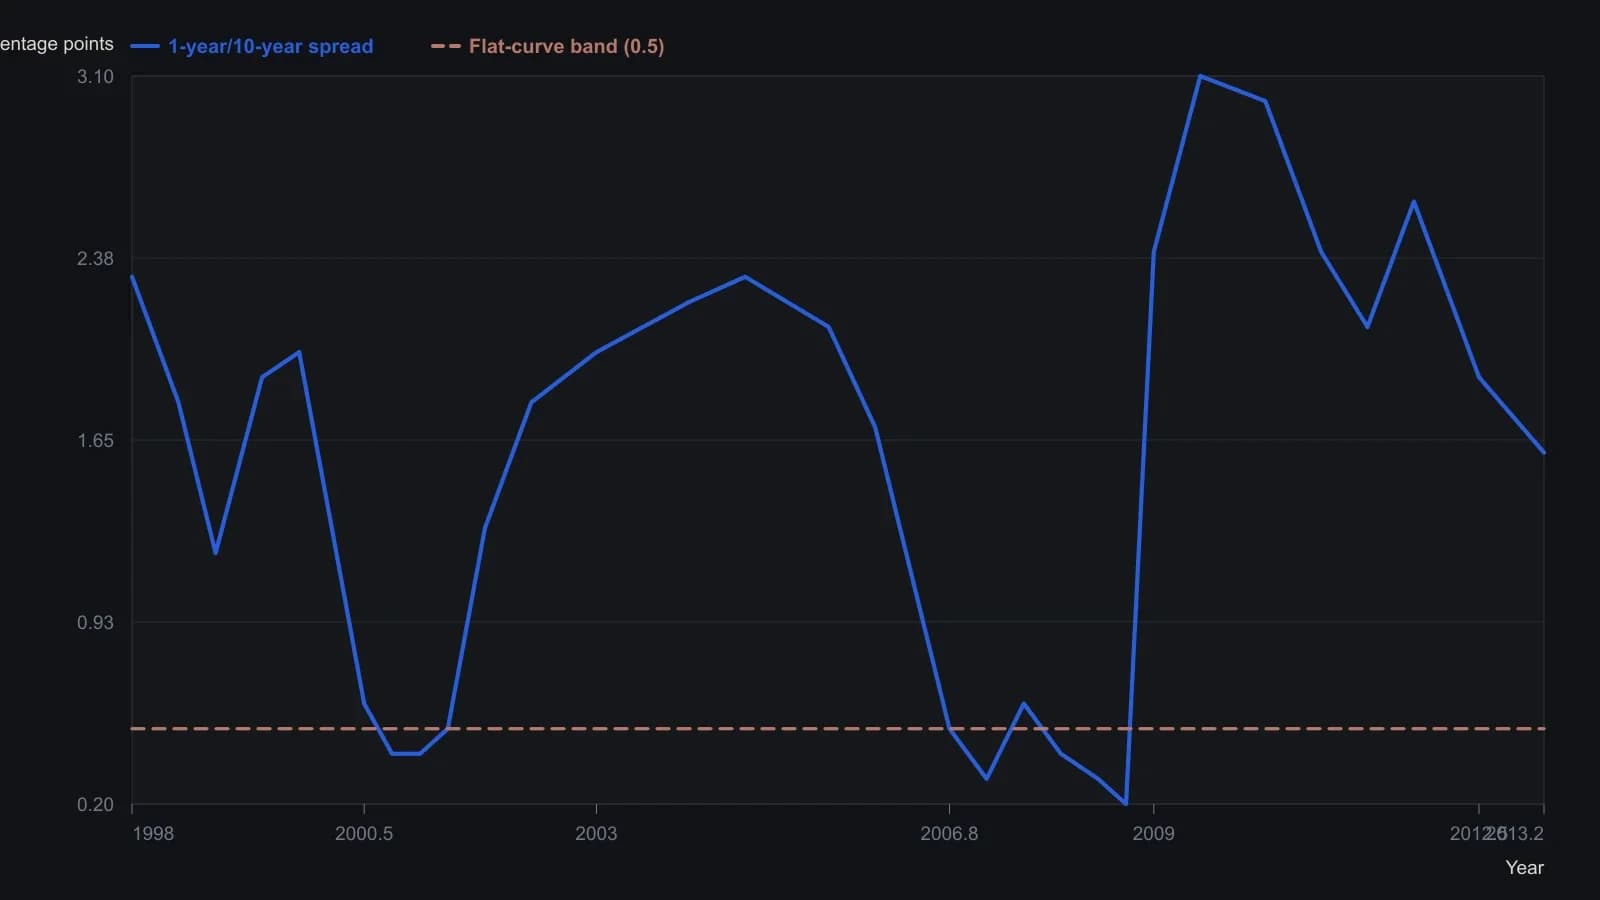
Siligardos treats values between 0 and 0.5 on the 1-year/10-year (or 2-year/10-year) spread as a flat curve in the five countries he studies. Brief dips below zero in late 2007 are marked on the DAX pane but are too thin to size on the spread fill, so they are not invented here.
An indirect link, not a timing rule
From early 1985 into early 1993 the United Kingdom one-year/10-year spread was mostly negative while the local equity index advanced. The 1990-92 recession also combined a negative spread with a rising equity market. The curve-equity link was therefore treated as indirect and filtered through how stocks react to each expansion or contraction.
After short-term policy rates were held near zero, the lack of an inverted curve was judged insufficient to rule out recession. A relatively flat curve was still viewed as compatible with a serious long-horizon equity decline. Curve analysis was restricted to a regime gauge: a long-horizon environmental reading of expected expansion or contraction, not a standalone entry or exit trigger.
All readings on this track · 33 readings
- 1990Policy-auction spread as a weekly equity regime filter
- 1992Electric utilities as bond-regime context
- 1992Reading the dollar as a rates-regime check
- 1992Evaluating weekly intermarket context for equity regimes
- 1993Specifying the stock-bond yield gap as a hold-or-abstain regime
- 1996Constructing dual-gate bond-fund entries from gold-silver jumps
- 1996Name the regime before the sector breakout
- 2002Falling prices flip stock-bond confirmation
- 2003Four sleeves on one regime board: gold miners, REITs, bills, and equities
- 2003Four currency regimes for the yen, loonie, pound and Australian dollar
- 2003Read gold through the dollar regime, the hedge spread, and a stop
- 2003When deflation flips the stock-bond map
- 2003Commodity subgroup regime boards and dual averages
- 2003Reading a liquidity regime when gold, bonds, and stocks rise together
- 2003A shared weekly checklist for four country funds
- 2004Size-and-style sleeves as a weekly regime map
- 2004Country closed-end funds shared one average checklist and four regimes
- 2004A 2004 four-pair snapshot of a dollar-bloc FX regime
- 2005Country closed-end funds as a weekly regime comparison
- 2005Weekly regime maps for production-weighted commodity subgroups
- 2005Four technology sleeves on one weekly regime map
- 2006The Australian dollar as a commodity regime and timing filter
- 2008Dual-listing moving averages as a crowd-regime test
- 2008Cross-market regime context for a single trade
- 2010Dollar index, cross rates, and commodity context for forex targets
- 2010Gold and silver forex session candles as metals-regime context
- 2012Yield curve regime and equity timing
- 2013Yield curve shapes as stock market regime context
- 2013Yield spreads as country-specific equity regime context
- 2016Credit spreads as an equity cash regime filter
- 2016The summer lull is a context error
- 2019Financial sector spreads as regime tells around a global stablecoin
- 2019The negative-yield regime as an equity intermarket filter