2016issue C0644-45
Credit spreads as an equity cash regime filter
A historical case applies a yield-spread indicator to a broad equity index and contrasts a spread-timed path with an unfiltered buy-and-hold path from late 2008. The walk-through favors a long-or-cash reading over automatic shorting when junk-bond spreads widen.
- A yield-spread indicator can mark buy and sell stances on a broad equity index, with arrows standing in for the overlay rather than for a single-asset trigger.
- Widening junk-bond spreads are treated as a financial-stress-signal and as a volatility-regime warning that different shocks can set off.
- The historical walk-through prefers a long-or-cash rule to automatic equity shorting when spreads deteriorate.
- The overlay is presented as reconstructable and historically testable on widely available charting platforms.
A yield-spread overlay on equities
A case illustration applies a yield-spread indicator to a broad equity index, with downward arrows marking a sell stance and upward arrows marking a buy stance.
The illustrated comparison contrasts a spread-timed equity path with an unfiltered buy-and-hold path over a window that begins in late 2008. The overlay is used to infer an intermarket-regime: a multi-week market state taken from credit-equity linkages rather than from a single-asset chart.
Spreads as a financial-stress-signal
Widening high-yield credit spreads are presented as a structural stress signal because investors tend to sell lower-quality bonds when markets come under pressure. That selling in junk-bonds is what widens the extra yield versus safer paper, and that extra yield is the yield-spread indicator mapped onto a buy or sell stance in equities.
Widening junk-bond spreads are framed as a volatility-regime warning that can be triggered by different shocks, including a commodity-price collapse or concentrated regional credit exposure. That widening is read as a financial-stress-signal of elevated market-wide volatility, whatever the proximate shock.
Long-or-cash rather than a default short
In the historical walk-through, reading the overlay as long-or-cash is described as more consistent than automatically shorting equities whenever spreads deteriorate.
After a downside moving-average-crossover in the spread indicator, remaining long is described as rarely meeting an immediate large drawdown that would instantly invalidate the stance.
An upside crossover around the middle of 2014 is described as coinciding with equities making further new highs, though in a more difficult trading environment.
Reconstructing the overlay
The spread overlay is presented as something a practitioner can reconstruct and historically test on widely available charting platforms.
S&P 500 weekly path, 2008–2016 case window
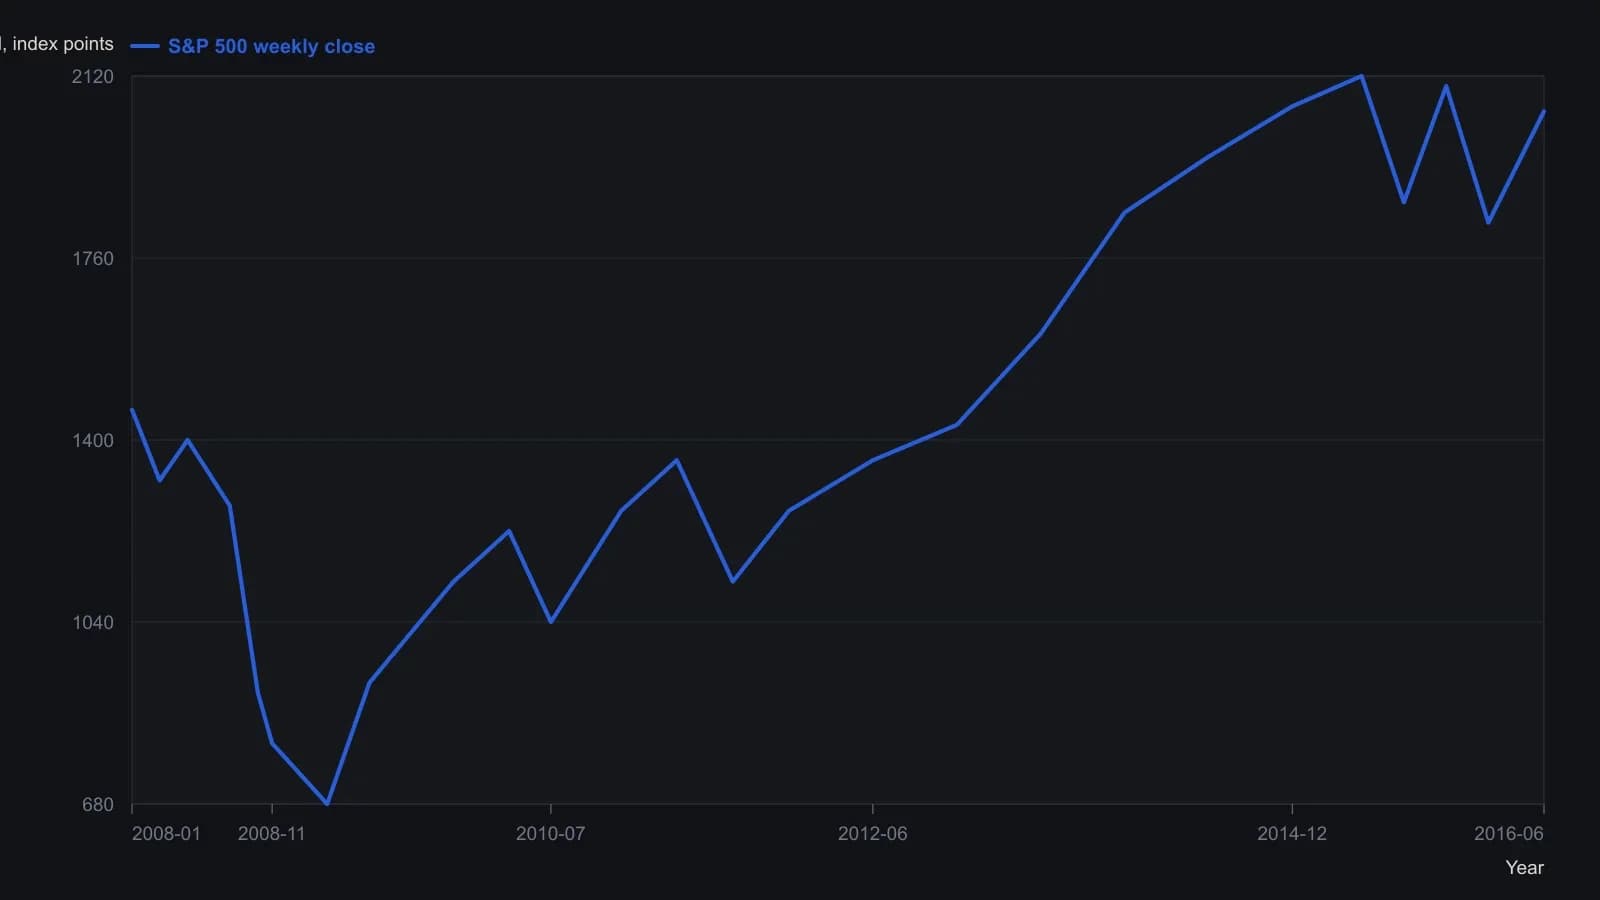
Raster readings are approximate. The pane shows only the index, not the yield-spread series or the cash-timed equity curve.
All readings on this track · 33 readings
- 1990Policy-auction spread as a weekly equity regime filter
- 1992Electric utilities as bond-regime context
- 1992Reading the dollar as a rates-regime check
- 1992Evaluating weekly intermarket context for equity regimes
- 1993Specifying the stock-bond yield gap as a hold-or-abstain regime
- 1996Constructing dual-gate bond-fund entries from gold-silver jumps
- 1996Name the regime before the sector breakout
- 2002Falling prices flip stock-bond confirmation
- 2003Four sleeves on one regime board: gold miners, REITs, bills, and equities
- 2003Four currency regimes for the yen, loonie, pound and Australian dollar
- 2003Read gold through the dollar regime, the hedge spread, and a stop
- 2003When deflation flips the stock-bond map
- 2003Commodity subgroup regime boards and dual averages
- 2003Reading a liquidity regime when gold, bonds, and stocks rise together
- 2003A shared weekly checklist for four country funds
- 2004Size-and-style sleeves as a weekly regime map
- 2004Country closed-end funds shared one average checklist and four regimes
- 2004A 2004 four-pair snapshot of a dollar-bloc FX regime
- 2005Country closed-end funds as a weekly regime comparison
- 2005Weekly regime maps for production-weighted commodity subgroups
- 2005Four technology sleeves on one weekly regime map
- 2006The Australian dollar as a commodity regime and timing filter
- 2008Dual-listing moving averages as a crowd-regime test
- 2008Cross-market regime context for a single trade
- 2010Dollar index, cross rates, and commodity context for forex targets
- 2010Gold and silver forex session candles as metals-regime context
- 2012Yield curve regime and equity timing
- 2013Yield curve shapes as stock market regime context
- 2013Yield spreads as country-specific equity regime context
- 2016Credit spreads as an equity cash regime filter
- 2016The summer lull is a context error
- 2019Financial sector spreads as regime tells around a global stablecoin
- 2019The negative-yield regime as an equity intermarket filter