1992issue C101-5
Reading the dollar as a rates-regime check
From late 1987 through mid-1992, bill futures and the dollar moved inversely, and bond futures later showed the same opposite path. Editorial reading: treat the currency view as a weeks-to-months regime check across the policy-impulse, duration-confirmation, and gold-lead, not as a standalone chart.
- Treat a currency view as a weeks-to-months regime check: confirm the dollar against Treasury bill futures for the policy-impulse before reading the Dollar Index alone.
- Seek duration-confirmation in Treasury bond futures, because rate markets often trend together and the same impulse should appear further out the curve.
- The historical record showed a bill-dollar-inverse from late 1987 through mid-1992 and a bond-dollar-inverse from mid-1990 to mid-1992, with several opposite turning points clustered in time.
- Use the policy-inflation-split and the gold-lead to watch whether the feedback-loop is reversing: a weaker dollar can later revive inflation fears that pressure bonds.
Why the dollar is not a standalone chart
From late 1987 through mid-1992, Treasury bill futures and the U.S. Dollar Index moved inversely, with rising bill-futures prices (falling short-term rates) aligned with a weaker dollar.
Editorial reading: put that currency view inside a weeks-to-months regime check. Confirm the dollar against bill futures first, then against bond futures, rather than treating the Dollar Index as a chart on its own.
Bills and the policy-impulse
An advance in Treasury bill futures that began in early 1989 coincided with a bearish stretch for the dollar. That pairing is the bill-dollar-inverse: rising bill futures mark falling short-term rates and a softer dollar.
Editorial label: the policy-impulse is the near-term rates signal, read mainly through Treasury bill futures, that shows whether official easing or tightening is already underway.
Dollar Index versus T-bill futures, late 1987–mid-1992
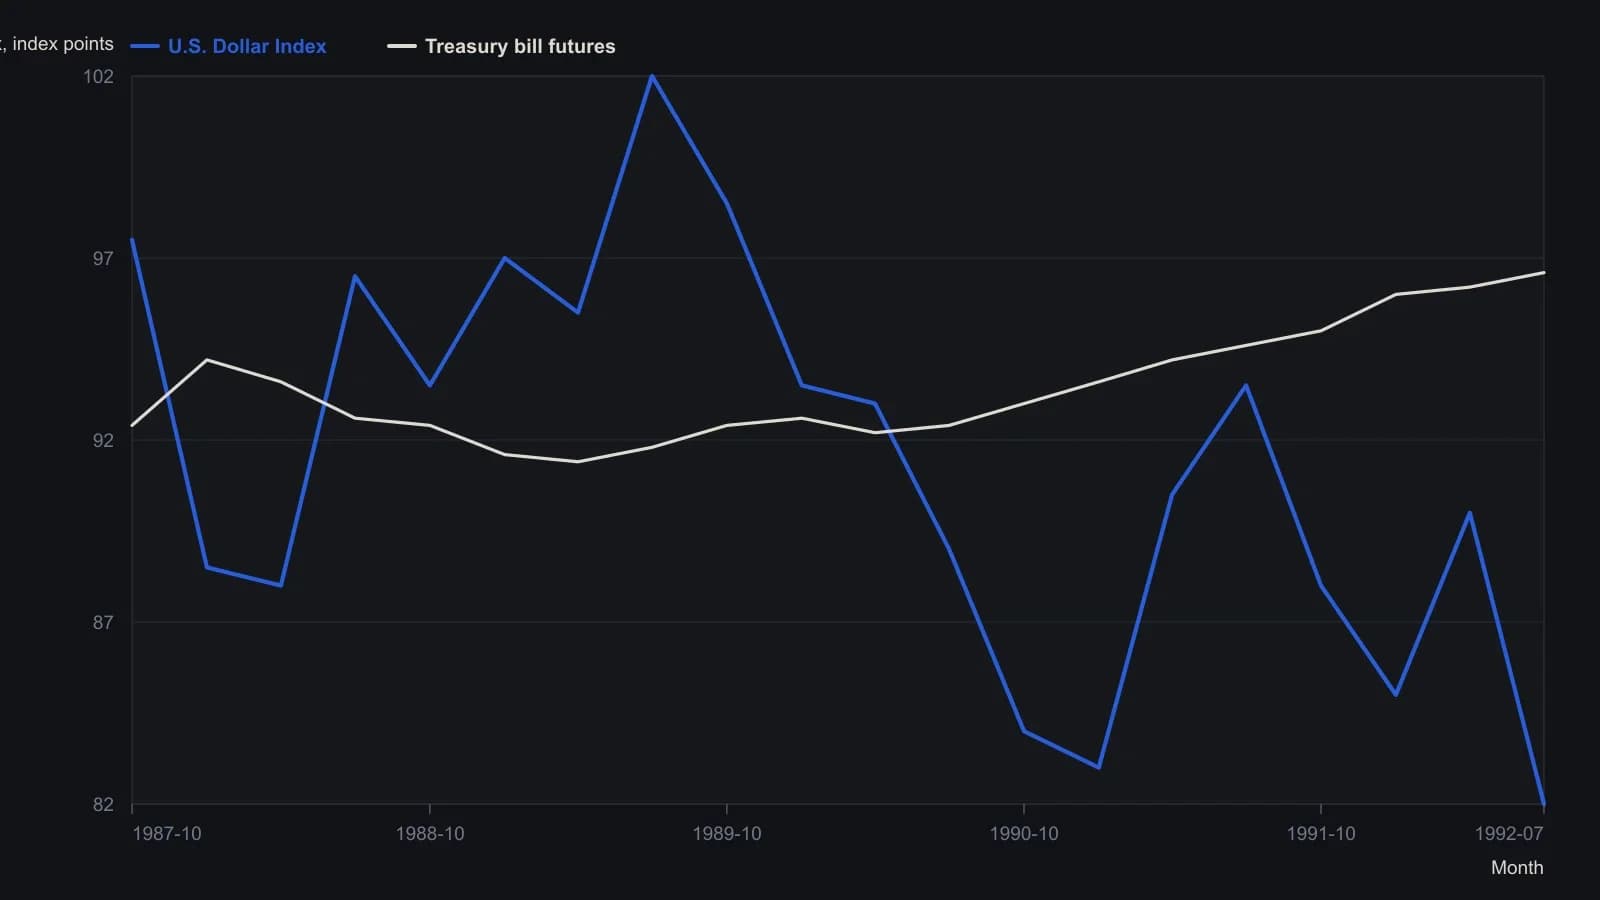
Two independent scales on one chart. Dollar Index is the left axis (about 80–105); T-bill futures are the inverted-looking right axis (about 90–97). Points are visual reads from the raster, so values are approximate and capped well below the plot’s weekly density.
Bonds and duration-confirmation
Because rate markets often trend together, Treasury bond prices also belong in the same dollar-regime reading as bill futures. Editorial label: duration-confirmation is a matching turn in Treasury bond futures that shows the same rates impulse appearing further out the curve.
From mid-1990 to mid-1992, the dollar index and Treasury bond futures again moved inversely, with several turning points arriving close together but in opposite directions. That bond-dollar-inverse included clustered turns: bond-price peaks in first-quarter 1991 and January 1992 coincided with dollar rebounds, while bond-price upturns in fourth-quarter 1990, summer 1991, and spring 1992 coincided with dollar downturns.
The December 1991 to mid-1992 window
In the December 1991 to mid-July 1992 window, a January 1992 drop in bond futures after a full-point discount-rate cut on December 20 accompanied a dollar rally, as rebound hopes lifted long-term yields.
When the recovery stalled and further easing was anticipated, bonds turned higher in April 1992 and the dollar moved lower.
Policy, inflation, and the gold-lead
Short-term rates mainly reflect official policy, while long-term yields also embed inflation expectations. Editorial label: that distinction is the policy-inflation-split. It creates a circular rates-dollar loop: firmer bond prices weigh on the dollar, and a weaker dollar later revives inflation fears that pressure bonds. Editorial label: that circular sequence is the feedback-loop.
A gold-market advance is treated as an early sign that the weaker-dollar side of that loop is beginning to feed inflation expectations. Editorial label: that tell is the gold-lead.
All readings on this track · 33 readings
- 1990Policy-auction spread as a weekly equity regime filter
- 1992Electric utilities as bond-regime context
- 1992Reading the dollar as a rates-regime check
- 1992Evaluating weekly intermarket context for equity regimes
- 1993Specifying the stock-bond yield gap as a hold-or-abstain regime
- 1996Constructing dual-gate bond-fund entries from gold-silver jumps
- 1996Name the regime before the sector breakout
- 2002Falling prices flip stock-bond confirmation
- 2003Four sleeves on one regime board: gold miners, REITs, bills, and equities
- 2003Four currency regimes for the yen, loonie, pound and Australian dollar
- 2003Read gold through the dollar regime, the hedge spread, and a stop
- 2003When deflation flips the stock-bond map
- 2003Commodity subgroup regime boards and dual averages
- 2003Reading a liquidity regime when gold, bonds, and stocks rise together
- 2003A shared weekly checklist for four country funds
- 2004Size-and-style sleeves as a weekly regime map
- 2004Country closed-end funds shared one average checklist and four regimes
- 2004A 2004 four-pair snapshot of a dollar-bloc FX regime
- 2005Country closed-end funds as a weekly regime comparison
- 2005Weekly regime maps for production-weighted commodity subgroups
- 2005Four technology sleeves on one weekly regime map
- 2006The Australian dollar as a commodity regime and timing filter
- 2008Dual-listing moving averages as a crowd-regime test
- 2008Cross-market regime context for a single trade
- 2010Dollar index, cross rates, and commodity context for forex targets
- 2010Gold and silver forex session candles as metals-regime context
- 2012Yield curve regime and equity timing
- 2013Yield curve shapes as stock market regime context
- 2013Yield spreads as country-specific equity regime context
- 2016Credit spreads as an equity cash regime filter
- 2016The summer lull is a context error
- 2019Financial sector spreads as regime tells around a global stablecoin
- 2019The negative-yield regime as an equity intermarket filter