2004issue C021-2
Size-and-style sleeves as a weekly regime map
Rank small versus large and growth versus value as four size-and-style-sleeve groups. Use a weekly-average-cross as the trend baseline, then read a breakout-confirmation so one equity idea sits inside that sleeve-ranking.
- Cross company size with a price-to-book-sort to form four size-and-style-sleeve groups, then use sleeve-ranking instead of reading any sleeve alone.
- Treat a 20-week average crossing a 50-week average as the weekly-average-cross that is the quantitative trend baseline.
- Treat a finished multipart-base or a cleared prior high as the breakout-confirmation that places one equity idea on the weekly map.
- In the archive case, small-cap value led after the March 2003 lows, large-cap value outpaced large-cap growth but lagged small-cap value, and small-cap growth challenged the spring 2002 highs only after its weekly-average-cross.
Four sleeves on one weekly map
A weekly regime dashboard can be built from four size-and-style-sleeve groups: small-cap growth, large-cap growth, small-cap value, and large-cap value. Sleeve-ranking compares which group is leading or lagging during the same market phase.
Editorial reading: the map puts a single equity idea into a diversified, regime-aware context. It is not a stand-alone forecast of the broad market.
How a price-to-book-sort builds the sleeves
Growth sleeves are built from names with higher price-to-book ratios and higher expected growth, while value sleeves are built from names with lower readings on both measures. That construction rule is a price-to-book-sort.
The two size groups do not share identical sector mixes, so a small-cap sleeve and a large-cap sleeve are not interchangeable even when both are labelled growth or value.
The weekly-average-cross as the baseline
Each sleeve is also read against its own weekly moving averages. A weekly-average-cross is a change in order between a shorter weekly average and a longer weekly average.
In this archive case the shorter average is the 20-week average and the longer average is the 50-week average. Editorial reading: that cross is the quantitative baseline against which later breakout-confirmation is judged.
Small-cap growth after a multipart-base
Small-cap growth left a three-low base in spring 2003. Editorial reading: that three-low area is a multipart-base, a prolonged low built from several distinct troughs before an advance tries to leave the range.
Its 20-week average crossed above its 50-week average in late spring or early summer of that year. After a brief September 2003 pullback, small-cap growth resumed its advance and, by the approach of November 2003, was challenging the spring 2002 highs.
Editorial reading: challenging those prior highs is the breakout-confirmation for that sleeve.
Large-cap growth as the slower sleeve
Large-cap growth stayed below its 20-week average through the late-2001 rebound, then rose from a three-stage 2002 to 2003 base more slowly than the small-cap growth sleeve.
Editorial reading: the three-stage low is another multipart-base, and the slower rise belongs to the sleeve-ranking rather than to a separate signal.
Small-cap value before and after the relapse
Small-cap value cleared both its 20-week and 50-week averages by November 2001, then relapsed into a downtrend from spring 2002 until the spring 2003 rebound.
Sleeve-ranking from the 2003 lows
From the March 2003 lows, small-cap value led large-cap value, large-cap growth, and small-cap growth, and by November 2003 it had cleared the spring 2002 highs.
Large-cap value and the summer-consolidation
From the spring 2003 lows, large-cap value outpaced large-cap growth but lagged small-cap value, then left a summer-long consolidation in late October and November 2003 with the early-2002 highs as the next reference.
Editorial reading: that pause is a summer-consolidation, a multi-month sideways range that later either fails or resolves with a fresh range expansion. The archive leaves the early-2002 highs as the next reference after that pause.
Placing one equity idea on the map
Editorial reading: a single equity idea is placed on this map only after the sleeve-ranking is known. The weekly-average-cross is the baseline for the sleeve, and the breakout-confirmation is the chart condition that locates the name inside a leading or lagging group.
The archive describes that historical workflow. It does not grade current names or state a present-day regime.
IWN weekly versus the 20-week and 50-week averages
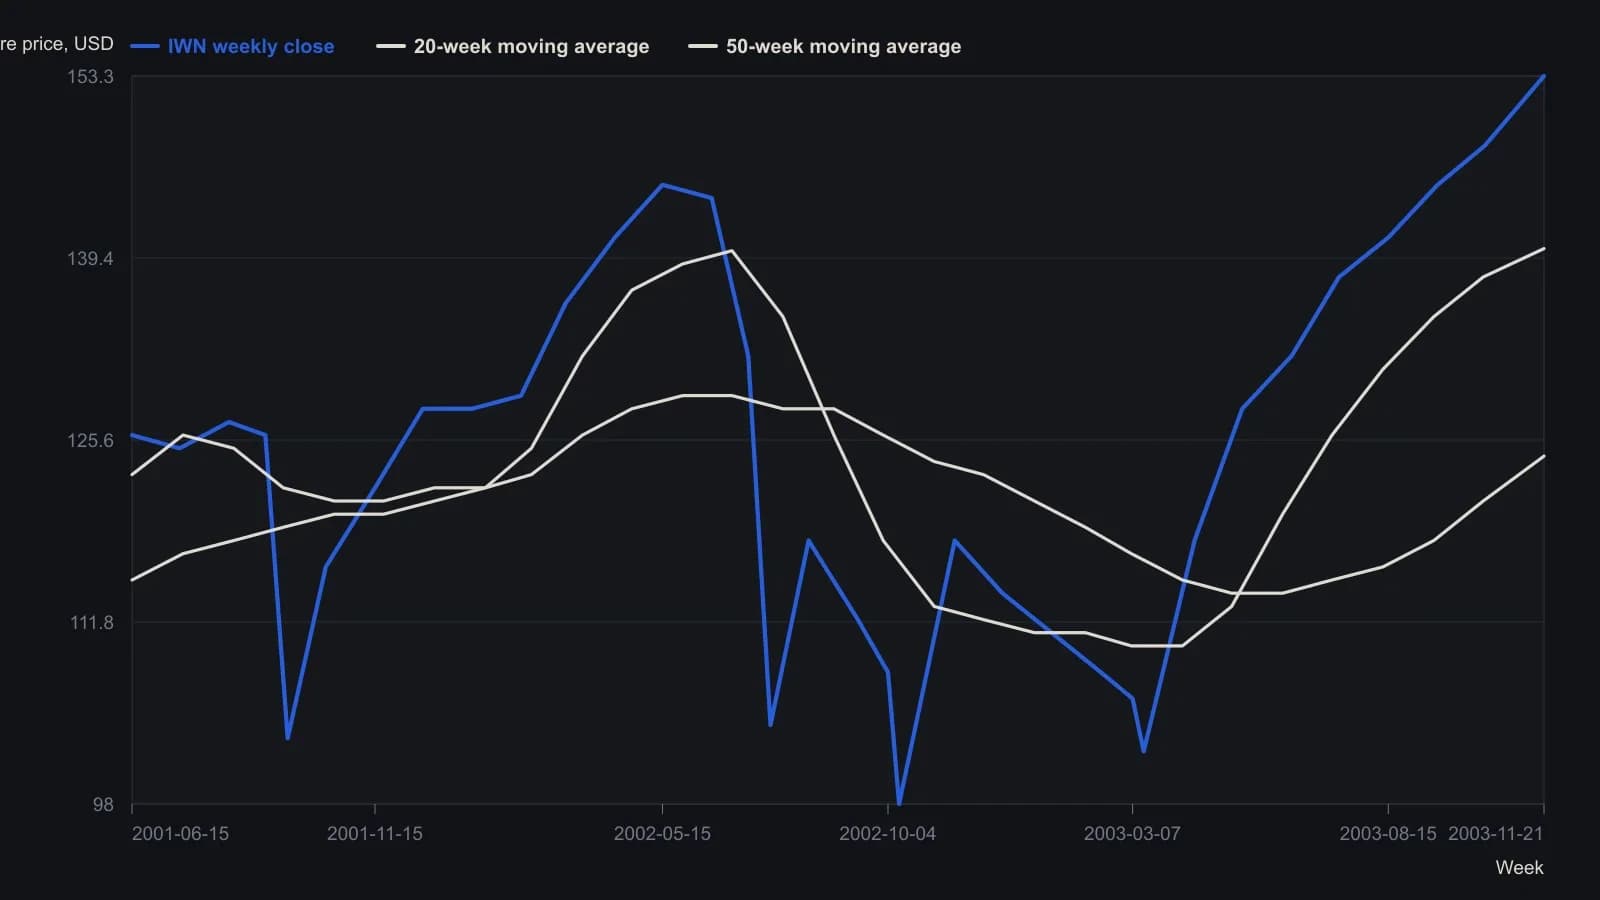
Digitized from the weekly candlestick plot. Only the final close and the two average readouts are printed on the source; earlier points are visual readings to the nearest dollar and are not official prints.
All readings on this track · 33 readings
- 1990Policy-auction spread as a weekly equity regime filter
- 1992Electric utilities as bond-regime context
- 1992Reading the dollar as a rates-regime check
- 1992Evaluating weekly intermarket context for equity regimes
- 1993Specifying the stock-bond yield gap as a hold-or-abstain regime
- 1996Constructing dual-gate bond-fund entries from gold-silver jumps
- 1996Name the regime before the sector breakout
- 2002Falling prices flip stock-bond confirmation
- 2003Four sleeves on one regime board: gold miners, REITs, bills, and equities
- 2003Four currency regimes for the yen, loonie, pound and Australian dollar
- 2003Read gold through the dollar regime, the hedge spread, and a stop
- 2003When deflation flips the stock-bond map
- 2003Commodity subgroup regime boards and dual averages
- 2003Reading a liquidity regime when gold, bonds, and stocks rise together
- 2003A shared weekly checklist for four country funds
- 2004Size-and-style sleeves as a weekly regime map
- 2004Country closed-end funds shared one average checklist and four regimes
- 2004A 2004 four-pair snapshot of a dollar-bloc FX regime
- 2005Country closed-end funds as a weekly regime comparison
- 2005Weekly regime maps for production-weighted commodity subgroups
- 2005Four technology sleeves on one weekly regime map
- 2006The Australian dollar as a commodity regime and timing filter
- 2008Dual-listing moving averages as a crowd-regime test
- 2008Cross-market regime context for a single trade
- 2010Dollar index, cross rates, and commodity context for forex targets
- 2010Gold and silver forex session candles as metals-regime context
- 2012Yield curve regime and equity timing
- 2013Yield curve shapes as stock market regime context
- 2013Yield spreads as country-specific equity regime context
- 2016Credit spreads as an equity cash regime filter
- 2016The summer lull is a context error
- 2019Financial sector spreads as regime tells around a global stablecoin
- 2019The negative-yield regime as an equity intermarket filter