2003issue C081-2
Commodity subgroup regime boards and dual averages
A world production-weighted commodity index can be judged as a whole and through weekly subgroup boards that share 20-period and 50-period moving averages. In the 2002-2003 case, agriculture, energies, precious metals, and livestock occupied different trend and support conditions, so one sector path was not the complex.
- A production-weighted commodity index can be read as a whole and as subgroup boards that use the same weekly 20-period and 50-period moving averages as a shared trend and support baseline.
- Agriculture rose through both averages late in the second quarter of 2002, peaked early that autumn, then declined into 2003, with wheat and corn weakness identified as a material driver and support found inside those averages in the first half of 2003.
- Energies and precious metals both met the 50-period average after a late-first-quarter 2003 correction, while livestock, after a sharp early-first-quarter dip, stayed in the upper part of its range.
- Editorial reading: those overlapping but non-identical board states are a regime split, which is why one subgroup move is not read as the whole market.
Judging the complex and its subgroup boards
A world production-weighted commodity index can be judged both as a whole and through subgroups that themselves serve as sector price benchmarks. A production-weighted index is a commodity benchmark whose component weights follow recent world output rather than equal or liquidity weights.
Those subgroups can be plotted as subgroup boards: sector slices of the same complex, drawn on weekly charts with both 20-period and 50-period moving averages. In this workflow a moving average is a defined lookback average of ordered prices used as a weekly trend and support baseline.
Agriculture
The agriculture subgroup covers grains plus several softs. It rose through both averages late in the second quarter of 2002, peaked early that autumn, then declined into 2003. In the first half of 2003 the board found support inside those averages. Weakness in wheat and corn was identified as a material driver of the agriculture subgroup's 2003 decline.
Energies
The energies subgroup cleared both averages in the second quarter of 2002, but only in the first quarter of 2003 looked able to lead those averages higher. A late-first-quarter 2003 correction then appeared to hold the 50-period average in the second quarter. Stubbornly high crude prices after the Iraq war and concern about natural-gas tightness were cited as supports for the energies subgroup during 2003.
Precious metals
The precious-metals subgroup, gold and silver, moved above both averages early in the first quarter of 2002 and advanced into the first quarter of 2003. It briefly slipped under the 50-period average in a late-first-quarter correction, then turned higher again as the second quarter of 2003 began. Gold's recovery after a long prior decline was identified as the main force lifting the precious-metals subgroup in the years leading into the case.
Livestock
The livestock subgroup includes live and feeder cattle plus lean hogs. It fell from a first-quarter 2002 peak to a late-third-quarter 2002 low, recovered to the 2002 highs by the fourth quarter, and after a sharp early-first-quarter 2003 dip stayed in the upper part of its range for three quarters.
GSCI agriculture subgroup ($GKX) weekly, 2002–2003
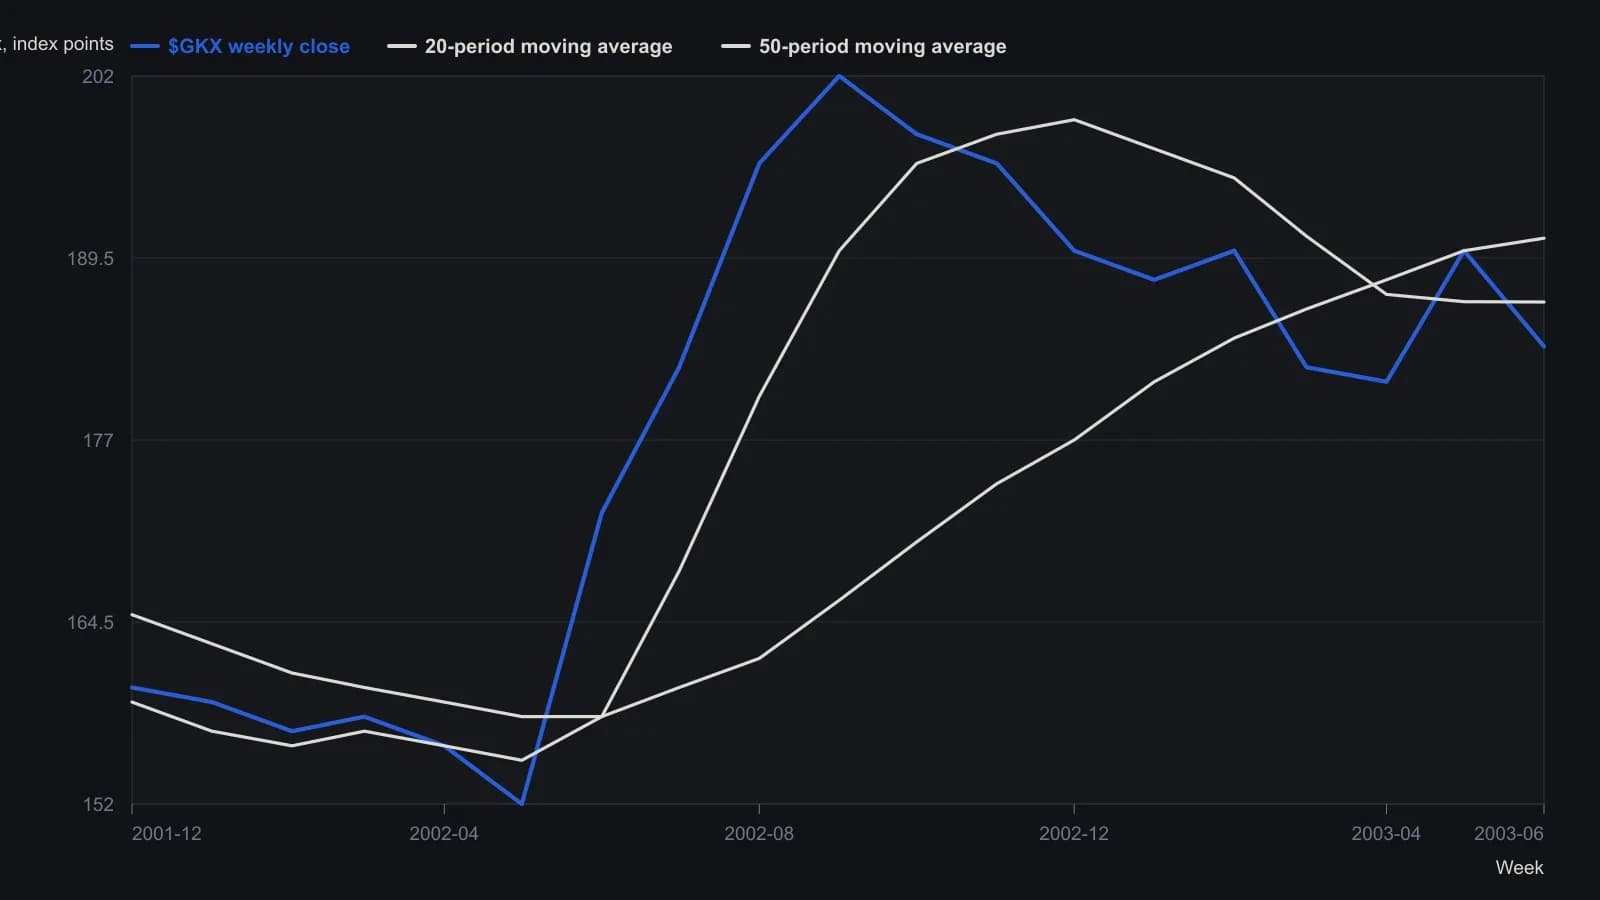
Weekly closes and the 20- and 50-period averages were sampled from the TradeStation raster at roughly monthly spacing. Levels are approximate to the printed scale (about 155–210).
Confirmation, support tests, and a regime split
A support location, often an average or a prior range edge, is treated as a hold-or-fail condition after a pullback. The energies board's apparent hold of the 50-period average, the precious-metals slip under that average, agriculture's support inside both averages, and livestock's hold in the upper part of its range are the same kind of test, applied on different boards.
Editorial reading: the four boards did not share one trend or support state in this case. That is a regime split, a state in which subgroups of the same commodity complex occupy different trend or support conditions at the same time. Confirmation would require the boards to occupy similar average and support conditions together.
All readings on this track · 33 readings
- 1990Policy-auction spread as a weekly equity regime filter
- 1992Electric utilities as bond-regime context
- 1992Reading the dollar as a rates-regime check
- 1992Evaluating weekly intermarket context for equity regimes
- 1993Specifying the stock-bond yield gap as a hold-or-abstain regime
- 1996Constructing dual-gate bond-fund entries from gold-silver jumps
- 1996Name the regime before the sector breakout
- 2002Falling prices flip stock-bond confirmation
- 2003Four sleeves on one regime board: gold miners, REITs, bills, and equities
- 2003Four currency regimes for the yen, loonie, pound and Australian dollar
- 2003Read gold through the dollar regime, the hedge spread, and a stop
- 2003When deflation flips the stock-bond map
- 2003Commodity subgroup regime boards and dual averages
- 2003Reading a liquidity regime when gold, bonds, and stocks rise together
- 2003A shared weekly checklist for four country funds
- 2004Size-and-style sleeves as a weekly regime map
- 2004Country closed-end funds shared one average checklist and four regimes
- 2004A 2004 four-pair snapshot of a dollar-bloc FX regime
- 2005Country closed-end funds as a weekly regime comparison
- 2005Weekly regime maps for production-weighted commodity subgroups
- 2005Four technology sleeves on one weekly regime map
- 2006The Australian dollar as a commodity regime and timing filter
- 2008Dual-listing moving averages as a crowd-regime test
- 2008Cross-market regime context for a single trade
- 2010Dollar index, cross rates, and commodity context for forex targets
- 2010Gold and silver forex session candles as metals-regime context
- 2012Yield curve regime and equity timing
- 2013Yield curve shapes as stock market regime context
- 2013Yield spreads as country-specific equity regime context
- 2016Credit spreads as an equity cash regime filter
- 2016The summer lull is a context error
- 2019Financial sector spreads as regime tells around a global stablecoin
- 2019The negative-yield regime as an equity intermarket filter