1996issue C051-5
Constructing dual-gate bond-fund entries from gold-silver jumps
A bond-fund long or short is defined only when a gold-and-silver index percent jump and a same-market trough gate or peak gate both fire. The jump lookback and the percent gates stay named inputs so a parameter freeze can replay one date window.
- A dual-gate defines a long or a short only when a gold-and-silver index percent jump and a bond-fund trough gate or peak gate are both true.
- The jump lookback was a searchable input from 5 to 25 in steps of 5, with a working value of 15.
- One encoding used the most recent peak and trough. Another stored a recursive high while not short and a recursive low while not long.
- After the first fill, reverse-in-market flipped the book at the close of the signal bar and stayed continuously long or short.
A dual-gate issues a signal only when an intermarket jump condition and a local peak-or-trough condition are both true. The traded series is a bond fund. The external series is a gold-and-silver index. Until both tests agree, no long and no short is defined.
Fidelity Government Bond Fund, 1990–1995
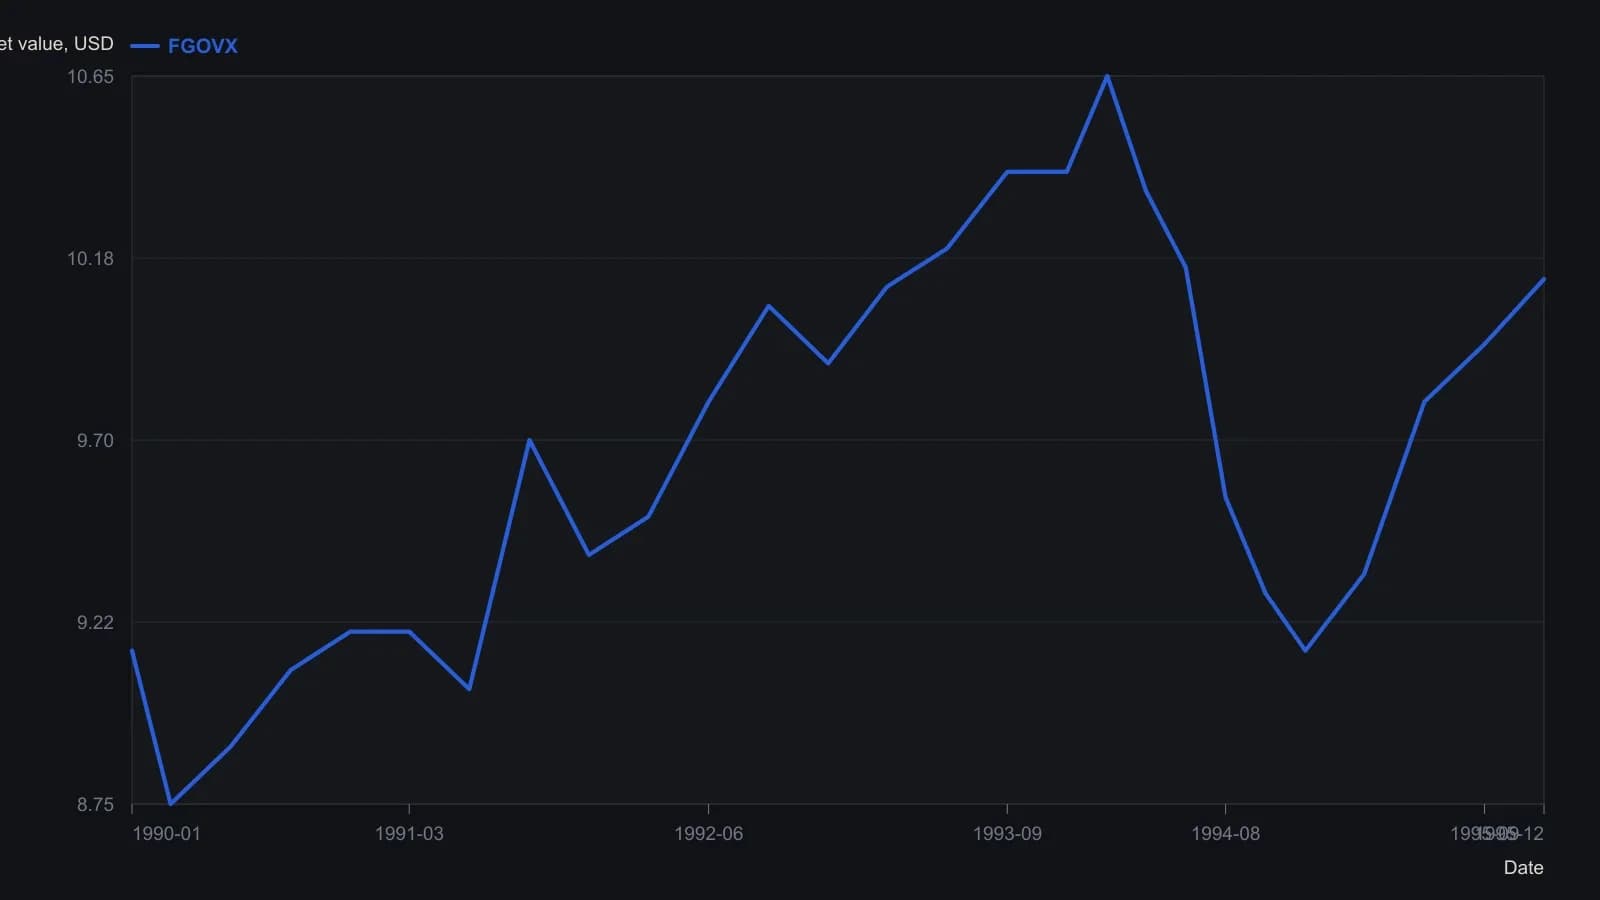
Digitized from a coarse mid-1990s MetaStock screenshot. Vertical resolution is roughly 0.05–0.10 NAV units except for the 10.12 header close. The upper XAU pane uses a different scale and is not mixed onto this axis.
Long and short definitions
A long is defined only when the gold-and-silver index percent change over a lag is below a downside threshold and the bond-fund close is above a trough scaled by an upside factor. That second test is the trough gate: the traded bond fund must have risen a stated percent from a stored low before a long is allowed.
A short is defined only when that same index percent change is above an upside threshold and the bond-fund close is below a peak scaled by a downside factor. That second test is the peak gate: the traded bond fund must have fallen a stated percent from a stored high before a short is allowed.
Named inputs and the jump lookback
The jump lookback is the bar lag used to measure percent change in the external gold-and-silver index. It was specified as a searchable input ranging from 5 to 25 in steps of 5, with a working value of 15.
A spreadsheet encoding measured the index jump as one hundred times the change versus a lagged index close, then required that jump and a bond-fund swing state to agree before a buy or sell.
Two encodings of the peak and trough
One encoding used the most recent peak and trough in the dual-gate instead of the extreme printed during the prior long or short episode.
Another encoding required both series in the signal: buy if the fund is 0.9 percent above a bottom and the index has fallen more than 4 percent; sell if the fund is 0.8 percent below a top and the index has risen more than 8 percent. That encoding stored a recursive high while not short and a recursive low while not long, then used those stored extremes in the buy and sell gates. A recursive extreme is a running high or low that updates only while the opposite position is not open.
Staying in the market after the first fill
After the first fill, that encoding stayed continuously in the market by reversing short-to-long or long-to-short at the close of the signal bar. Reverse-in-market means that after the first fill, each opposite dual-gate flips the book at the close so the procedure stays continuously long or short.
Freezing inputs for a walk-through
A walk-through is constructed by narrowing the chart date window and freezing a search variable into a constant so the rule ignores that input. Parameter freeze is replacing a searched input with a constant so a chosen date window can be replayed without re-searching that input.
Editorial reading: write every lag and percent gate as a named input so the same dual-gate procedure can be frozen and replayed on one date window.
All readings on this track · 33 readings
- 1990Policy-auction spread as a weekly equity regime filter
- 1992Electric utilities as bond-regime context
- 1992Reading the dollar as a rates-regime check
- 1992Evaluating weekly intermarket context for equity regimes
- 1993Specifying the stock-bond yield gap as a hold-or-abstain regime
- 1996Constructing dual-gate bond-fund entries from gold-silver jumps
- 1996Name the regime before the sector breakout
- 2002Falling prices flip stock-bond confirmation
- 2003Four sleeves on one regime board: gold miners, REITs, bills, and equities
- 2003Four currency regimes for the yen, loonie, pound and Australian dollar
- 2003Read gold through the dollar regime, the hedge spread, and a stop
- 2003When deflation flips the stock-bond map
- 2003Commodity subgroup regime boards and dual averages
- 2003Reading a liquidity regime when gold, bonds, and stocks rise together
- 2003A shared weekly checklist for four country funds
- 2004Size-and-style sleeves as a weekly regime map
- 2004Country closed-end funds shared one average checklist and four regimes
- 2004A 2004 four-pair snapshot of a dollar-bloc FX regime
- 2005Country closed-end funds as a weekly regime comparison
- 2005Weekly regime maps for production-weighted commodity subgroups
- 2005Four technology sleeves on one weekly regime map
- 2006The Australian dollar as a commodity regime and timing filter
- 2008Dual-listing moving averages as a crowd-regime test
- 2008Cross-market regime context for a single trade
- 2010Dollar index, cross rates, and commodity context for forex targets
- 2010Gold and silver forex session candles as metals-regime context
- 2012Yield curve regime and equity timing
- 2013Yield curve shapes as stock market regime context
- 2013Yield spreads as country-specific equity regime context
- 2016Credit spreads as an equity cash regime filter
- 2016The summer lull is a context error
- 2019Financial sector spreads as regime tells around a global stablecoin
- 2019The negative-yield regime as an equity intermarket filter