2005issue C081-2
Country closed-end funds as a weekly regime comparison
A 2005 case review set four NYSE-listed country closed-end funds beside one another and read weekly moving averages, a shared low, and a peak that was not held. In editorial terms, those readings form a comparative regime map rather than four stand-alone setups.
- Four NYSE-listed country closed-end funds covering Brazil, Israel, Chile, and Ireland were placed side by side as one intermarket set.
- Weekly moving averages were used as multi-week regime lines, not as same-day triggers, across the Brazil, Israel, and Ireland cases.
- The Israel-focused fund shared an August 2004 low with the US market, treated as cross-market confirmation. The Chile-focused fund did not convert a late-2004 peak into enduring new highs.
- The Ireland-focused fund often closed below its faster weekly line in early to mid-2004 but not beneath the slower line, which was treated as longer-average support ahead of a later rise.
Four country funds, one listing venue
A 2005 case review placed four NYSE-listed single-country closed-end funds, covering Brazil, Israel, Chile, and Ireland, side by side as one intermarket set. A country closed-end fund is a listed share that packages many local-market holdings into one portfolio, so one chart can stand in for a national equity mix.
The four funds were identified as long-running NYSE closed-end listings from April 1988, October 1992, September 1989, and March 1990. Each held a mix of local industrial, financial, and other sector names rather than a single stock.
Brazil and the weekly averages
The Brazil-focused fund was read against 10-, 20-, and 50-week moving averages. A weekly moving average is a multi-week average of closes used as a regime line, not as a same-day trigger.
The fund stayed above the 10-week line through the later three quarters of 2003, corrected for about six months into late spring 2004, then moved above the 20- and 50-week averages in summer 2004.
Israel, a shared low, and the US market
The Israel-focused fund was described as advancing through 2003, then moving sideways in 2004. Closes fell under the 20-week average in the second quarter, and the 50-week average was briefly broken in the third quarter.
The same fund was described as sharing an August 2004 low with the US market before a later multi-week uptrend. A shared low is a trough that appears in both a country fund and a reference market at about the same time, used as cross-market confirmation.
Chile and a peak without follow-through
The Chile-focused fund was described as failing to convert a late-2004 peak into enduring new highs, even as many other equities and funds advanced from mid- to late 2004. That episode sat inside a bull market dated from October 2002.
Follow-through is continued acceptance above a prior peak, as opposed to a high that is not held. In editorial terms, the Chile case is dissent inside the set: a local peak that was not held while many other equities and funds advanced.
Ireland and longer-average support
The Ireland-focused fund was described as closing frequently below its 20-week average in late first-quarter and second-quarter 2004 without a close beneath the 50-week average. That slower line was treated as late-spring support ahead of a fourth-quarter 2004 rise.
Longer-average support is a test of a slower weekly average that holds while a faster average is lost, used as a support-and-resistance hypothesis rather than as a same-week trigger.
Brazil Fund weekly closes versus 20- and 50-week averages
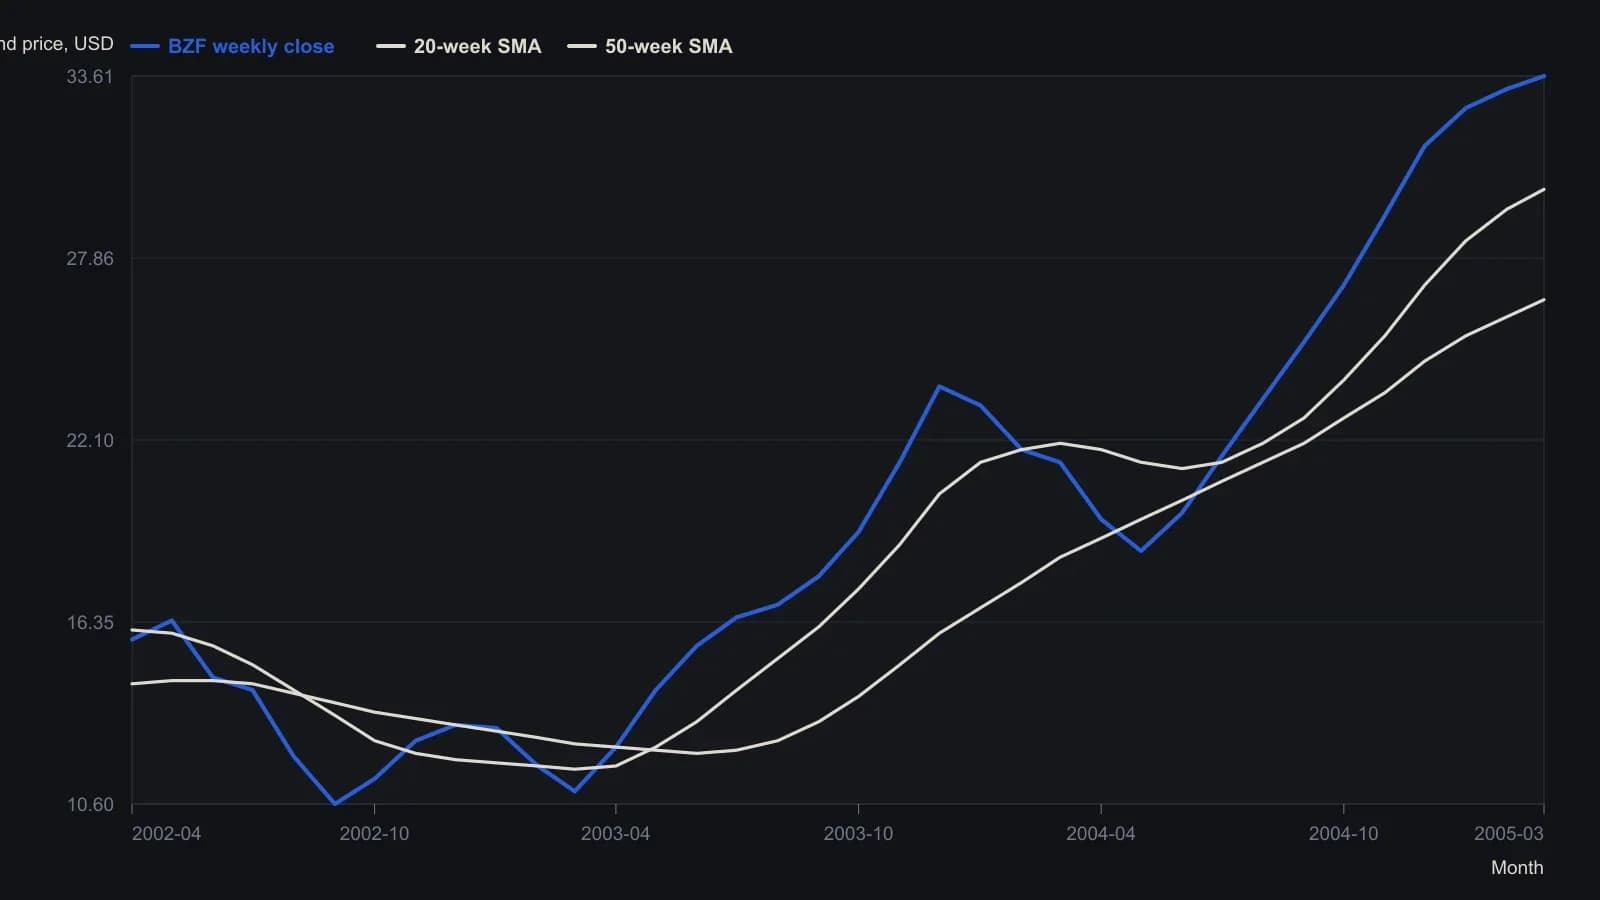
Prophet weekly candles, 3-year window. Closes sampled about monthly from the raster; only the terminal quote and the two moving-average readouts are exact printouts from the chart chrome.
Price cases and local policy context
Each price case was paired with contemporaneous country-level capital-flow or policy context. The pairings were hesitation over new energy investment in Brazil, debate over privatizing a state bank in Israel, Chile-China talks that included copper trade, and Ireland's tax-and-EU-funds growth path.
Those notes sit in regime context: the diversified or cross-market setting in which a single country-fund chart is judged, rather than as a stand-alone setup.
What the comparison is for
The archive facts describe a historical workflow. TradersWeek's editorial view is that the comparison is the point, not any one fund. Weekly averages locate each country closed-end fund in a multi-week regime. A shared low with a benchmark is confirmation. A peak without follow-through is dissent. Longer-average support is a slower line that holds after a faster line is lost.
None of that is a present-day ranking of these listings, and the case review does not establish later performance.
All readings on this track · 33 readings
- 1990Policy-auction spread as a weekly equity regime filter
- 1992Electric utilities as bond-regime context
- 1992Reading the dollar as a rates-regime check
- 1992Evaluating weekly intermarket context for equity regimes
- 1993Specifying the stock-bond yield gap as a hold-or-abstain regime
- 1996Constructing dual-gate bond-fund entries from gold-silver jumps
- 1996Name the regime before the sector breakout
- 2002Falling prices flip stock-bond confirmation
- 2003Four sleeves on one regime board: gold miners, REITs, bills, and equities
- 2003Four currency regimes for the yen, loonie, pound and Australian dollar
- 2003Read gold through the dollar regime, the hedge spread, and a stop
- 2003When deflation flips the stock-bond map
- 2003Commodity subgroup regime boards and dual averages
- 2003Reading a liquidity regime when gold, bonds, and stocks rise together
- 2003A shared weekly checklist for four country funds
- 2004Size-and-style sleeves as a weekly regime map
- 2004Country closed-end funds shared one average checklist and four regimes
- 2004A 2004 four-pair snapshot of a dollar-bloc FX regime
- 2005Country closed-end funds as a weekly regime comparison
- 2005Weekly regime maps for production-weighted commodity subgroups
- 2005Four technology sleeves on one weekly regime map
- 2006The Australian dollar as a commodity regime and timing filter
- 2008Dual-listing moving averages as a crowd-regime test
- 2008Cross-market regime context for a single trade
- 2010Dollar index, cross rates, and commodity context for forex targets
- 2010Gold and silver forex session candles as metals-regime context
- 2012Yield curve regime and equity timing
- 2013Yield curve shapes as stock market regime context
- 2013Yield spreads as country-specific equity regime context
- 2016Credit spreads as an equity cash regime filter
- 2016The summer lull is a context error
- 2019Financial sector spreads as regime tells around a global stablecoin
- 2019The negative-yield regime as an equity intermarket filter