2003issue C071-4
When deflation flips the stock-bond map
When a deflationary climate inverts the usual stock-bond price link, a four-asset map of equities, government bonds, commodities, and the dollar becomes the regime check. Commodities and the dollar then sort weakness in financial assets into inflation stress or a deflationary bind.
- A standard intermarket cycle ties firmer rates and a stronger dollar to later peaks in gold, a broad commodity basket, bond prices, and then equities, after which easier rates reverse the same chain.
- In a deflationary climate with an overvalued currency, the normally positive stock-bond price link can invert, so bond prices move opposite equities and yields become the more useful equity lead.
- Japanese government bonds and the Nikkei 225 in the 1990s, and the S&P 500 and the 10-year Treasury into the early 2000s, showed bond prices rising while equities fell or later moved sideways.
- Joint declines in stocks and bonds were read through the commodity-dollar pair: rising commodities and a weaker dollar implied inflation stress, while falling commodities and a stronger dollar implied a deflationary bind.
The four-asset map and the intermarket cycle
A four-asset map is a working snapshot of equities, government bonds, a broad commodity basket, and the dollar. It is used to place one market in a larger regime.
A standard intermarket cycle ties firmer rates and a stronger dollar to later peaks in gold, a broad commodity index, bond prices, and then equities. After that sequence, easier rates reverse the same chain.
Core pairings in that framework include an inverse link between commodities and bonds, an inverse link between the dollar and commodities, and a normally positive link between stocks and bonds. The dollar and commodity pairing is the commodity-dollar inverse.
A deflationary inversion of the stock-bond sign
In a deflationary climate with an overvalued currency, that normally positive stock-bond price link can invert. Bond prices then move opposite equities, and bond yields start to lead stocks.
That pattern is a deflationary inversion. The stock-bond sign has changed, and yields rather than bond prices become the more useful equity lead.
Japan and the United States as sign-flip cases
A 1990s comparison of Japanese government bonds and the Nikkei 225 showed bond prices climbing in a nearly unbroken rise while equity prices swung widely on a largely downward path.
For three consecutive years into the early 2000s, the S&P 500 and the 10-year Treasury moved in opposite directions, with equities lower and the government long bond higher. After the July 2002 lows, the S&P 500 spent about nine months in sideways trade while the government long-bond advance remained in force.
S&P 500 weekly during the 2000–03 decline
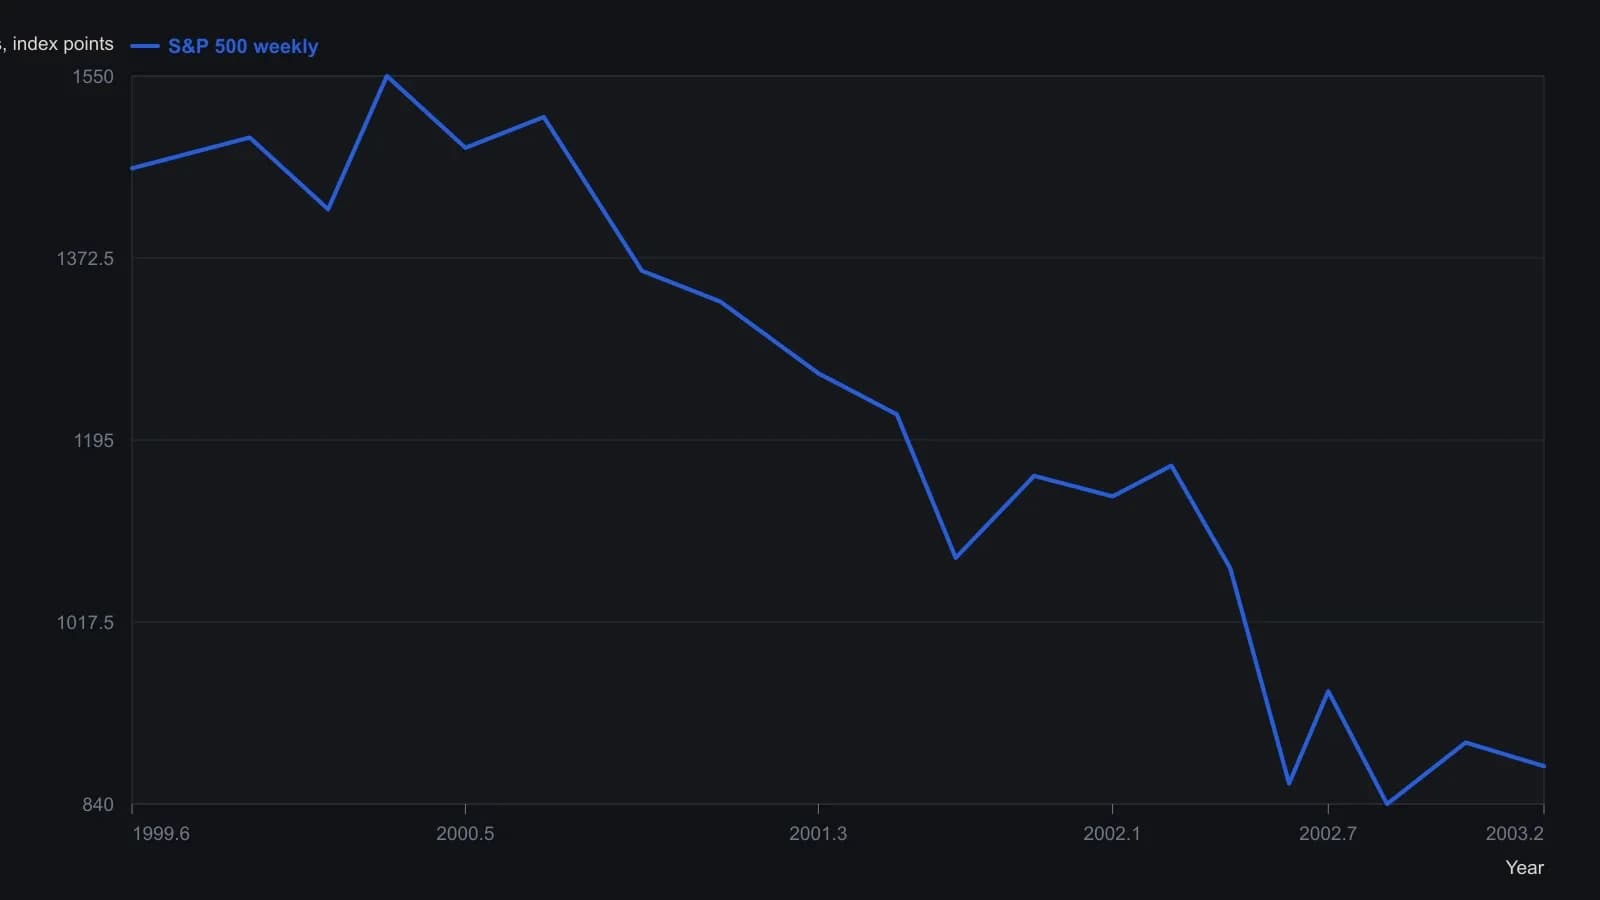
Closes are visual readings against the labeled weekly scale; only the 876.90 last print is an exact source figure. Estimates are rounded to the nearest ten index points to match raster resolution. The companion 10-year T-bond pane uses a different price scale and is not overlaid.
Commodities, the dollar, and the 2003 fork
Gold and crude advanced through 2002 and peaked early in 2003 after sharing relative bottoms around 1999. Gold's later low came in early 2001, while crude's 2001 high sat on a rise that began in 1999.
A broad commodity basket appeared to top in 2003, even after allowing for a grain bear market of more than five years. Dollar futures looked to be bottoming after a long decline and had moved opposite commodities for more than a year.
If a deflationary inverse stock-bond link still dominated, further equity weakness would be expected to coincide with even lower long-bond yields. An equity advance extending into the second quarter of 2003 would be expected to coincide with lower bond prices and higher yields.
Joint declines in stocks and bonds were read differently by the commodity-dollar pair. Rising commodities and a weaker dollar would imply inflation stress. Falling commodities and a stronger dollar would imply a deflationary bind.
Editorial note: that check is the reflation test. Weaker financial assets are sorted by whether they coincide with stronger commodities and a softer dollar, or with weaker commodities and a firmer dollar.
All readings on this track · 33 readings
- 1990Policy-auction spread as a weekly equity regime filter
- 1992Electric utilities as bond-regime context
- 1992Reading the dollar as a rates-regime check
- 1992Evaluating weekly intermarket context for equity regimes
- 1993Specifying the stock-bond yield gap as a hold-or-abstain regime
- 1996Constructing dual-gate bond-fund entries from gold-silver jumps
- 1996Name the regime before the sector breakout
- 2002Falling prices flip stock-bond confirmation
- 2003Four sleeves on one regime board: gold miners, REITs, bills, and equities
- 2003Four currency regimes for the yen, loonie, pound and Australian dollar
- 2003Read gold through the dollar regime, the hedge spread, and a stop
- 2003When deflation flips the stock-bond map
- 2003Commodity subgroup regime boards and dual averages
- 2003Reading a liquidity regime when gold, bonds, and stocks rise together
- 2003A shared weekly checklist for four country funds
- 2004Size-and-style sleeves as a weekly regime map
- 2004Country closed-end funds shared one average checklist and four regimes
- 2004A 2004 four-pair snapshot of a dollar-bloc FX regime
- 2005Country closed-end funds as a weekly regime comparison
- 2005Weekly regime maps for production-weighted commodity subgroups
- 2005Four technology sleeves on one weekly regime map
- 2006The Australian dollar as a commodity regime and timing filter
- 2008Dual-listing moving averages as a crowd-regime test
- 2008Cross-market regime context for a single trade
- 2010Dollar index, cross rates, and commodity context for forex targets
- 2010Gold and silver forex session candles as metals-regime context
- 2012Yield curve regime and equity timing
- 2013Yield curve shapes as stock market regime context
- 2013Yield spreads as country-specific equity regime context
- 2016Credit spreads as an equity cash regime filter
- 2016The summer lull is a context error
- 2019Financial sector spreads as regime tells around a global stablecoin
- 2019The negative-yield regime as an equity intermarket filter