2005issue C111-2
Four technology sleeves on one weekly regime map
A 2005 intermarket case placed four technology-adjacent sleeves on one weekly map. A weekly-average-cross marked sleeve leadership, a taken-out-weekly-low marked regime failure, and range-compression versus an upside-breakout showed why the related markets had to be read together.
- A 2005 case put four technology-adjacent intermarket-sleeve prices on one weekly map: an internet trust, a 45-name software index, a 19-name semiconductor index, and a telecommunications trust.
- A weekly-average-cross of the 20-week average above the 50-week average marked 2003 leadership. Later taken-out-weekly-low prints in software and semiconductors marked regime failure.
- By 2005 the semiconductor sleeve appeared to print an upside-breakout from a multi-month range, while the telecommunications sleeve stayed in range-compression with a ceiling at 30 still unbreached.
- Editorial reading: the four sleeves did not share one regime, so the technology complex had to be read as a map rather than as a single market.
Four technology sleeves on one weekly map
A 2005 intermarket case placed four technology-adjacent sleeves in one weekly map: an internet exchange-traded trust, a software index of 45 names, a semiconductor index of 19 names, and a telecommunications exchange-traded trust.
Both sector trusts were described as exchange-traded products that confer direct ownership of the underlying stocks, unlike conventional exchange-traded funds. Each basket is treated as an intermarket-sleeve so several related prices can be compared in the same weekly regime map.
Internet sleeve: a weekly-average-cross without a taken-out low
In the internet sleeve, a 20-week moving average crossed above a 50-week moving average in spring 2003. A later three-year window showed price off a late-2004 high after a sharp summer-2004 correction, with no major weekly low taken out.
Editorial reading: the spring-2003 weekly-average-cross, and the later absence of a major taken-out-weekly-low, kept this sleeve in a leadership reading on the map even after the summer-2004 correction.
Software sleeve: leadership, then taken-out weekly lows
In the software index, a 20-week exponential moving average crossed above a 50-week exponential moving average in summer 2003. The first half of 2004 then took out weekly lows from early 2004 and late 2003 as price slipped below both averages.
After a second-half-2004 rebound and a late-2004 high, the software index again fell below both weekly averages in an early-2005 correction, then by late summer 2005 was closing consistently above the 20-week and 50-week exponential moving averages.
Editorial reading: the first-half-2004 taken-out-weekly-low prints marked regime failure after the summer-2003 weekly-average-cross. The late-summer-2005 closes back above both exponential moving averages were a later repair of the weekly averages, not a sign that the 2003 regime had remained intact.
Software index weekly averages and regime breaks
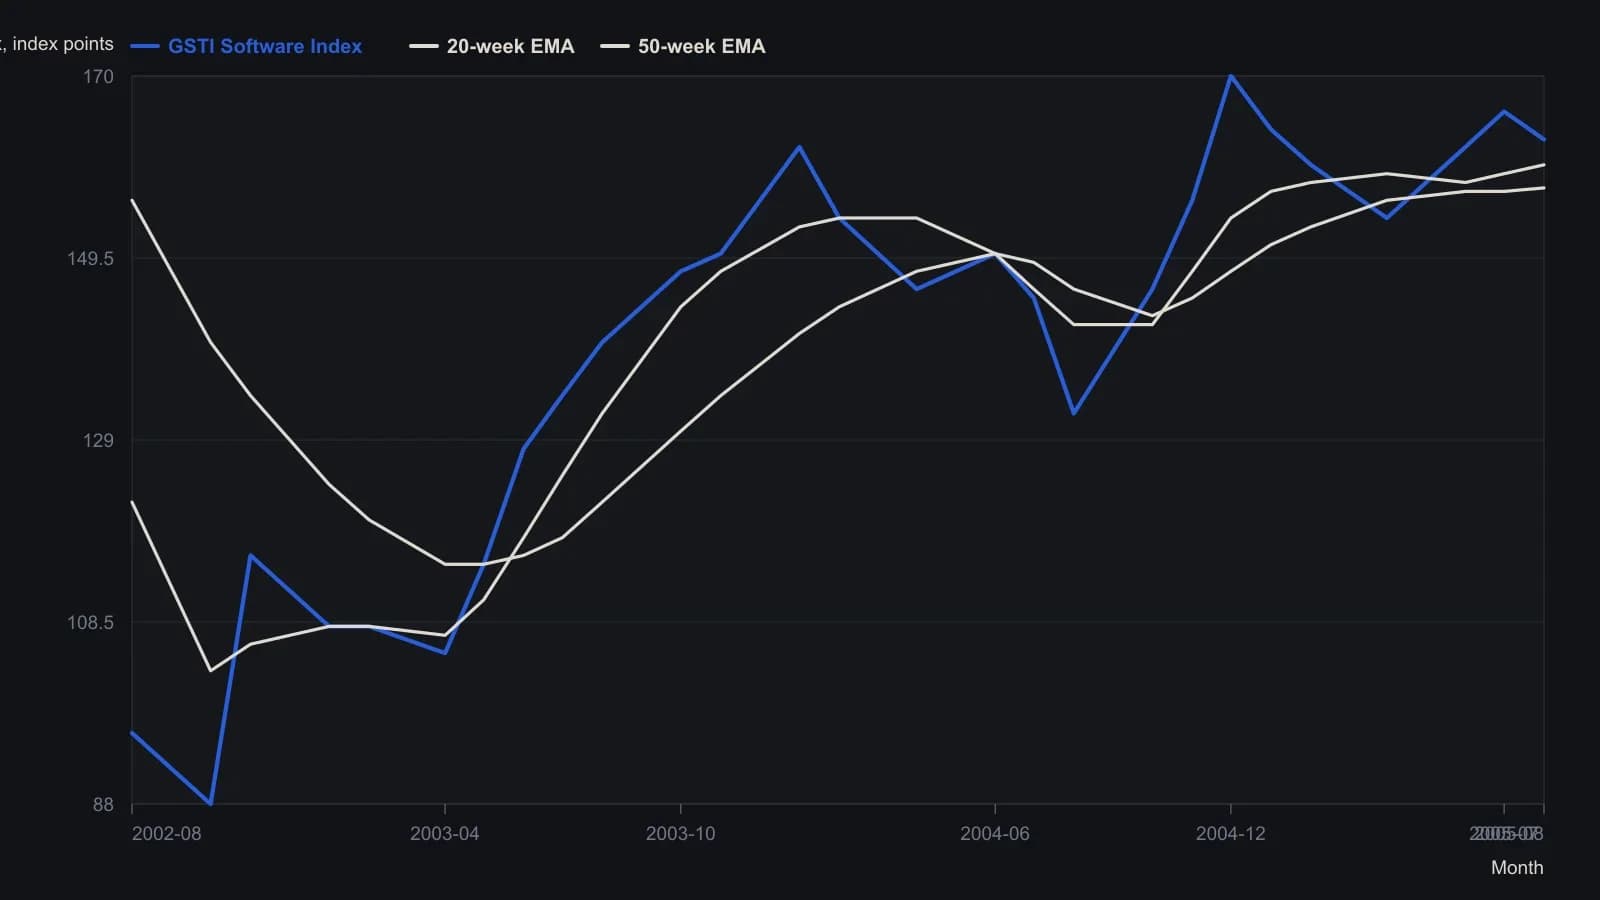
Read off a weekly candlestick raster at the printed month ticks; values follow the chart grid and are not official session closes. The source plotted 20-week and 50-week exponential moving averages.
Semiconductor sleeve: decline, range, then an upside-breakout
The semiconductor index also saw its 20-week exponential moving average move above its 50-week exponential moving average in summer 2003, peaked late in 2003, and then declined through the first three quarters of 2004 while taking out numerous weekly lows.
After that semiconductor decline stalled in summer 2004, the index spent several months in a trading range and then appeared to break out to the upside in summer 2005.
Editorial reading: the 2004 sequence of taken-out-weekly-low prints ended the prior advance. The summer-2005 upside-breakout is a chart condition to test rather than a completed outcome.
Telecommunications sleeve: range-compression under an unbreached ceiling
The telecommunications trust stayed compressed after late-2002 lows: a 10-point range later tightened to four points by summer 2004 and to two points in 2005, with a ceiling at 30 still unbreached.
Editorial reading: that path is range-compression ending at an unbreached ceiling, not an upside-breakout. Set beside the semiconductor sleeve, the same complex held both a ceiling at 30 and a summer-2005 upside-breakout.
Editorial reading: one complex, four regimes
Editorial reading: a weekly-average-cross in 2003 did not keep the four intermarket-sleeve prices on one path. The internet sleeve held structure through 2004. Software and semiconductors printed taken-out-weekly-low failures. Semiconductors later tested an upside-breakout, while telecommunications stayed in range-compression. The case is a regime map for related markets, not a single-market signal.
All readings on this track · 33 readings
- 1990Policy-auction spread as a weekly equity regime filter
- 1992Electric utilities as bond-regime context
- 1992Reading the dollar as a rates-regime check
- 1992Evaluating weekly intermarket context for equity regimes
- 1993Specifying the stock-bond yield gap as a hold-or-abstain regime
- 1996Constructing dual-gate bond-fund entries from gold-silver jumps
- 1996Name the regime before the sector breakout
- 2002Falling prices flip stock-bond confirmation
- 2003Four sleeves on one regime board: gold miners, REITs, bills, and equities
- 2003Four currency regimes for the yen, loonie, pound and Australian dollar
- 2003Read gold through the dollar regime, the hedge spread, and a stop
- 2003When deflation flips the stock-bond map
- 2003Commodity subgroup regime boards and dual averages
- 2003Reading a liquidity regime when gold, bonds, and stocks rise together
- 2003A shared weekly checklist for four country funds
- 2004Size-and-style sleeves as a weekly regime map
- 2004Country closed-end funds shared one average checklist and four regimes
- 2004A 2004 four-pair snapshot of a dollar-bloc FX regime
- 2005Country closed-end funds as a weekly regime comparison
- 2005Weekly regime maps for production-weighted commodity subgroups
- 2005Four technology sleeves on one weekly regime map
- 2006The Australian dollar as a commodity regime and timing filter
- 2008Dual-listing moving averages as a crowd-regime test
- 2008Cross-market regime context for a single trade
- 2010Dollar index, cross rates, and commodity context for forex targets
- 2010Gold and silver forex session candles as metals-regime context
- 2012Yield curve regime and equity timing
- 2013Yield curve shapes as stock market regime context
- 2013Yield spreads as country-specific equity regime context
- 2016Credit spreads as an equity cash regime filter
- 2016The summer lull is a context error
- 2019Financial sector spreads as regime tells around a global stablecoin
- 2019The negative-yield regime as an equity intermarket filter