2004issue C071-2
A 2004 four-pair snapshot of a dollar-bloc FX regime
A 2004 intermarket case study grouped the euro, Australian dollar, and British pound as 2002 breakouts that later corrected toward a shared fifty-week exponential moving average, while USD/JPY tested that same weekly line as resistance.
- The euro, Australian dollar, and British pound were grouped as 2002 breakouts that corrected toward fifty-week exponential moving-average support in the first quarter of 2004.
- The euro 2002 breakout was read as a multi-year advance that followed that weekly average, with spring-2004 top fears after a pullback and named support near 1.1380 and 1.0765.
- USD/JPY was described as topping in spring 2002, falling through 2002 and 2003, then testing the same fifty-week exponential moving average as resistance while attempting an intermediate-term bottom in spring 2004.
- The Australian dollar was framed as a commodity currency and a US-dollar hedge; the yen was framed as a finance currency tied to Japanese equities, rates, and real estate.
Three majors that broke out together
A 2004 intermarket case study grouped the euro, the Australian dollar, and the British pound as having broken out in 2002 and then corrected toward fifty-week exponential moving-average support in the first quarter of 2004.
The euro 2002 breakout was read as a multi-year advance whose slope followed a fifty-week exponential moving average, with spring-2004 top fears appearing after a pullback to that average. The euro review named further support near 1.1380 and, lower, near 1.0765 if then-current levels failed.
Euro weekly rate versus its 50-week EMA
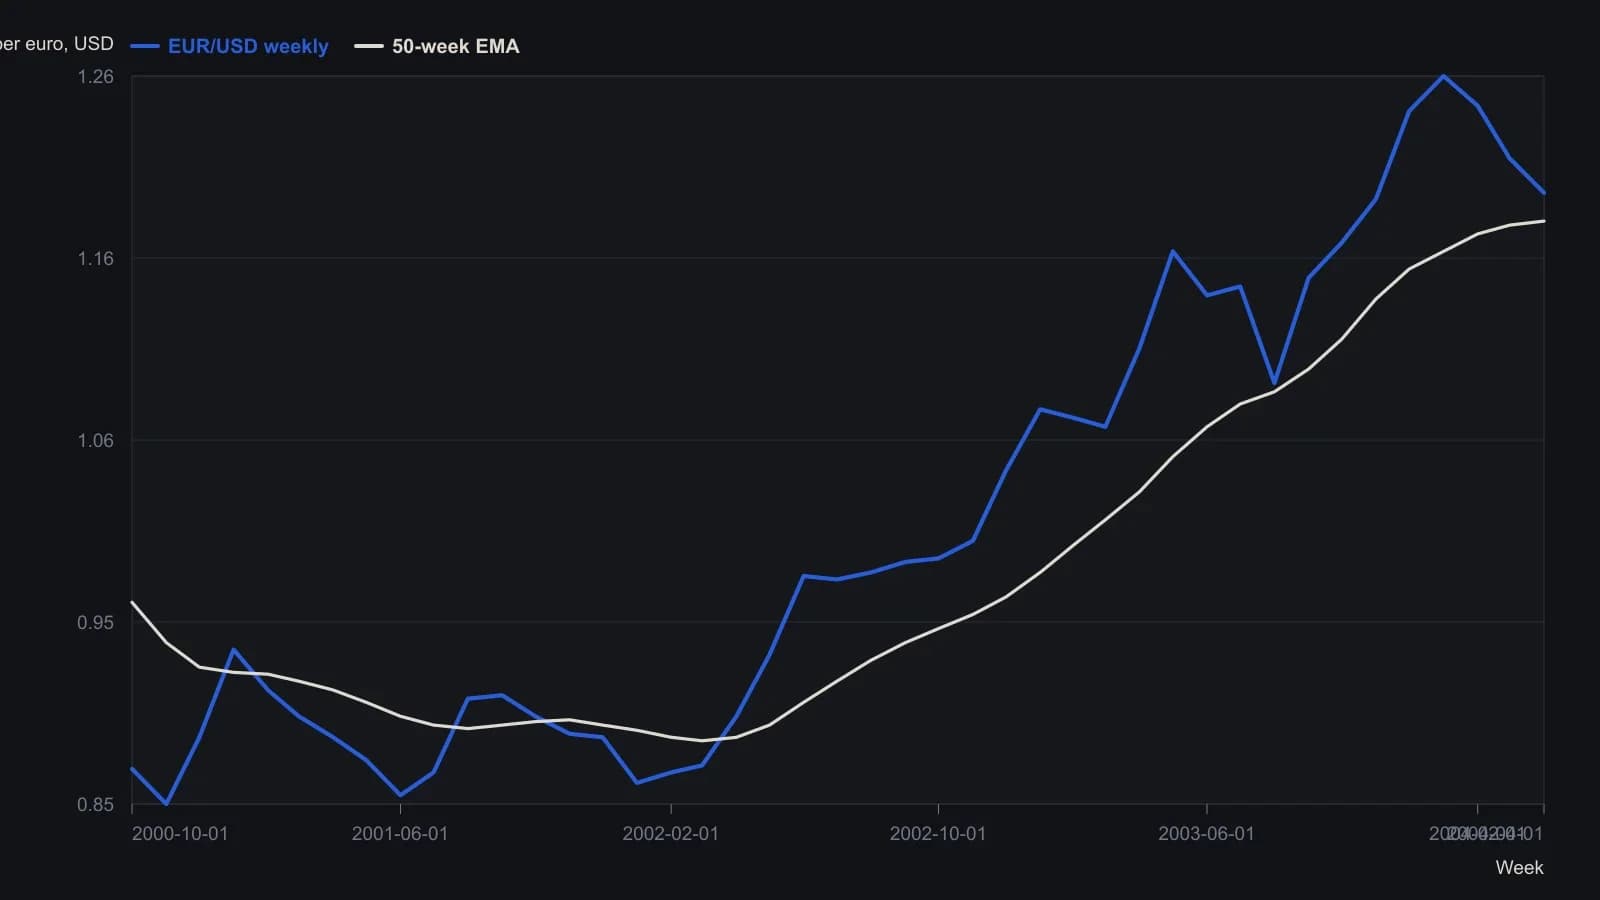
Monthly samples from weekly candles; raster tolerance is about 0.005. Printed last-bar labels kept as shown. The copy’s lower supports at 1.1380 and 1.0765 are not plotted.
Commodity-currency, sterling, and hedge context
The Australian dollar was framed as a commodity currency linked to resource exports and Asian demand, and as a hedge against US-dollar exposure after an early-summer 2002 breakout and a sharp first-quarter 2004 correction.
The British pound 2002 breakout was placed with the euro and the Australian dollar. After a mid-2003 consolidation and a late-2003 resumption, it also retreated toward its fifty-week exponential moving average in early 2004.
USD/JPY as resistance on the same weekly line
USD/JPY was described as topping in spring 2002, declining through 2002 and 2003, then testing the fifty-week exponential moving average as resistance on at least two occasions in spring 2004 while attempting an intermediate-term bottom.
The yen was treated as a finance currency driven more by Japanese equities, rates, and real estate than by commodity output, in contrast with commodity currencies such as the Australian dollar.
Reserve weighting next to the euro chart
Reserve-allocation commentary in the review argued that even a 10% rise in euro weighting implied large buying given the scale of global currency reserves.
Editorial note: that remark places the euro breakout inside a reserve-flow reading of the same dollar-bloc regime, so the weekly chart is set beside portfolio weights rather than treated as a standalone pattern.
All readings on this track · 33 readings
- 1990Policy-auction spread as a weekly equity regime filter
- 1992Electric utilities as bond-regime context
- 1992Reading the dollar as a rates-regime check
- 1992Evaluating weekly intermarket context for equity regimes
- 1993Specifying the stock-bond yield gap as a hold-or-abstain regime
- 1996Constructing dual-gate bond-fund entries from gold-silver jumps
- 1996Name the regime before the sector breakout
- 2002Falling prices flip stock-bond confirmation
- 2003Four sleeves on one regime board: gold miners, REITs, bills, and equities
- 2003Four currency regimes for the yen, loonie, pound and Australian dollar
- 2003Read gold through the dollar regime, the hedge spread, and a stop
- 2003When deflation flips the stock-bond map
- 2003Commodity subgroup regime boards and dual averages
- 2003Reading a liquidity regime when gold, bonds, and stocks rise together
- 2003A shared weekly checklist for four country funds
- 2004Size-and-style sleeves as a weekly regime map
- 2004Country closed-end funds shared one average checklist and four regimes
- 2004A 2004 four-pair snapshot of a dollar-bloc FX regime
- 2005Country closed-end funds as a weekly regime comparison
- 2005Weekly regime maps for production-weighted commodity subgroups
- 2005Four technology sleeves on one weekly regime map
- 2006The Australian dollar as a commodity regime and timing filter
- 2008Dual-listing moving averages as a crowd-regime test
- 2008Cross-market regime context for a single trade
- 2010Dollar index, cross rates, and commodity context for forex targets
- 2010Gold and silver forex session candles as metals-regime context
- 2012Yield curve regime and equity timing
- 2013Yield curve shapes as stock market regime context
- 2013Yield spreads as country-specific equity regime context
- 2016Credit spreads as an equity cash regime filter
- 2016The summer lull is a context error
- 2019Financial sector spreads as regime tells around a global stablecoin
- 2019The negative-yield regime as an equity intermarket filter