1990issue C021-5
Policy-auction spread as a weekly equity regime filter
A weekly equity holding can be treated as a stay-exposed or stay-out decision. The archive workflow smooths the policy-auction-spread, converts the sign of the smoothed-spread into a positive-regime or negative-regime state, and checks those states against historical equity paths and open-signal-drawdown.
- The weekly policy-auction-spread is the administered discount rate minus the three-month bill auction yield.
- That difference is refreshed as a smoothed-spread with a 15-week exponential average that applies 0.875 to the previous average and 0.125 to the newest difference.
- The long-side rule starts when the smoothed-spread turns positive and stays in force until that average turns negative.
- Editorial reading: evaluate the regime-overlay by how cleanly the two states separate historical equity paths and open-signal-drawdown, not as a next-week price forecast.
A weekly holding as a regime decision
The archive workflow places one equity holding inside a rate-and-policy context. It does not ask the next sampling interval to be predicted from the latest price.
Editorial reading: use the sign of the smoothed-spread as a stay-exposed versus stay-out choice. Judge the procedure by how cleanly those states separate historical equity paths and open-signal-drawdown.
From policy-auction-spread to smoothed-spread
The weekly input is the administered discount rate minus the three-month bill auction yield. That difference is the policy-auction-spread.
A market bill yield below the administered policy rate is treated as the bullish intermarket state. The reverse is treated as the bearish state.
That difference is then smoothed with a 15-week exponential average that applies 0.875 to the previous average and 0.125 to the newest difference. The result is the smoothed-spread.
A worked weekly update used a 7 percent discount rate, a 7.9 percent bill yield, and a prior average of -0.70 to obtain a new average of -0.73. That new average remains below zero, so the update stays in negative-regime.
The long-side rule
The long-side rule starts when the 15-week average turns positive and stays in force until that average turns negative.
Positive-regime is the state in which the smoothed-spread is above zero and treated as the stay-exposed equity window. Negative-regime is the state in which the smoothed-spread is below zero and treated as the abstention or defensive window.
How the historical check was recorded
The historical check used weekly updates from 1953 and recorded the S&P 500 path plus the largest interim close-to-close decline while each long signal was open. That largest interim decline is the open-signal-drawdown.
The two-state wealth comparison assumed an S&P 500-matching holding and left out dividends, commissions, and taxes.
The same crossing rule was described as less dependable for exits than for entries, including a later negative-regime interval during which the equity benchmark later advanced.
Editorial reading: keep more weight on entries and on open-signal-drawdown than on treating every move into negative-regime as a finished exit call.
Buy-signal versus sell-signal S&P 500 wealth from the TB/DR weekly filter
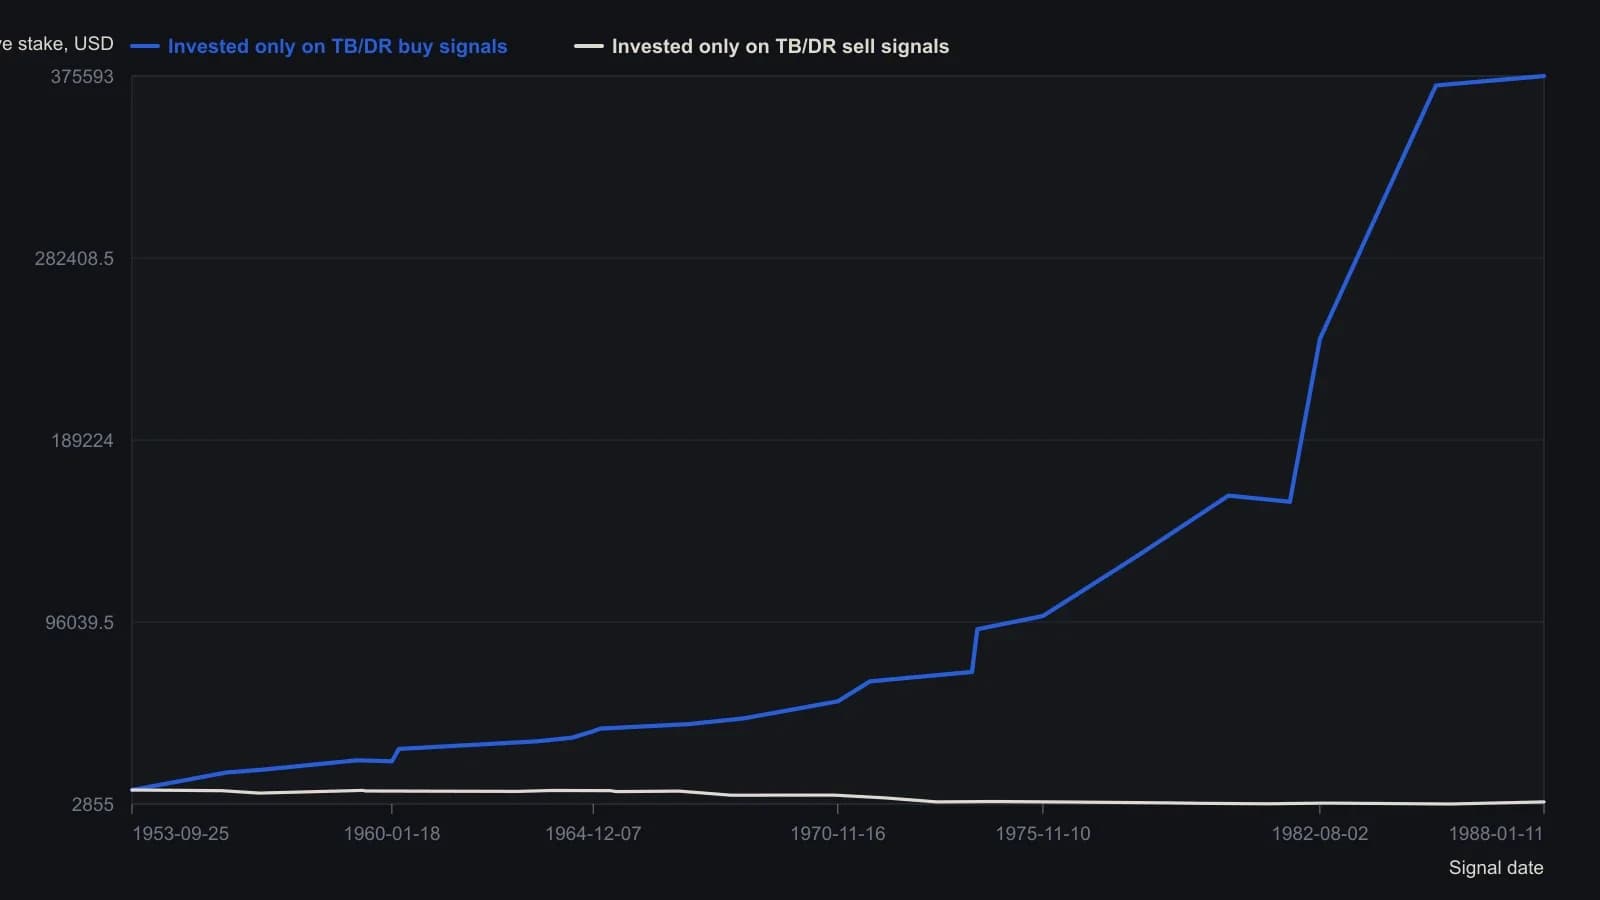
Source table ends the last sell path as of 18 August 1989 (asterisk). Dividends, commissions and taxes are omitted, matching the article. Dates use month/day/year as printed.
All readings on this track · 33 readings
- 1990Policy-auction spread as a weekly equity regime filter
- 1992Electric utilities as bond-regime context
- 1992Reading the dollar as a rates-regime check
- 1992Evaluating weekly intermarket context for equity regimes
- 1993Specifying the stock-bond yield gap as a hold-or-abstain regime
- 1996Constructing dual-gate bond-fund entries from gold-silver jumps
- 1996Name the regime before the sector breakout
- 2002Falling prices flip stock-bond confirmation
- 2003Four sleeves on one regime board: gold miners, REITs, bills, and equities
- 2003Four currency regimes for the yen, loonie, pound and Australian dollar
- 2003Read gold through the dollar regime, the hedge spread, and a stop
- 2003When deflation flips the stock-bond map
- 2003Commodity subgroup regime boards and dual averages
- 2003Reading a liquidity regime when gold, bonds, and stocks rise together
- 2003A shared weekly checklist for four country funds
- 2004Size-and-style sleeves as a weekly regime map
- 2004Country closed-end funds shared one average checklist and four regimes
- 2004A 2004 four-pair snapshot of a dollar-bloc FX regime
- 2005Country closed-end funds as a weekly regime comparison
- 2005Weekly regime maps for production-weighted commodity subgroups
- 2005Four technology sleeves on one weekly regime map
- 2006The Australian dollar as a commodity regime and timing filter
- 2008Dual-listing moving averages as a crowd-regime test
- 2008Cross-market regime context for a single trade
- 2010Dollar index, cross rates, and commodity context for forex targets
- 2010Gold and silver forex session candles as metals-regime context
- 2012Yield curve regime and equity timing
- 2013Yield curve shapes as stock market regime context
- 2013Yield spreads as country-specific equity regime context
- 2016Credit spreads as an equity cash regime filter
- 2016The summer lull is a context error
- 2019Financial sector spreads as regime tells around a global stablecoin
- 2019The negative-yield regime as an equity intermarket filter