2004issue C041-2
Country closed-end funds shared one average checklist and four regimes
TKF, MXF, TRF, and IFN were read with the same 20-day and 50-day location and the same range-or-breakout rules. The overlay still classified four different structures, and only each market’s inflation, policy, and legal backdrop named the intermarket regime a portfolio was holding.
- TKF, MXF, TRF, and IFN were listed closed-end country funds for Turkey, Mexico, Russia and Eastern Europe, and India, so each traded price was a compact proxy for that market’s listed-equity regime.
- The same 20-day and 50-day moving-average location plus a range-or-breakout reading classified TKF as still range-bound, MXF as recovered and above both averages, TRF as trending at a multi-year high, and IFN as a confirmed post-breakout advance.
- MXF’s rebound through 2003 was a prior-decline retracement of about half the 2002 downswing, which is not the same claim as a completed regime change.
- Editorial reading: freeze the chart rules across the strip, then use the local inflation, policy, and legal backdrop to name the intermarket regime actually held.
Four listed country proxies
TKF, MXF, TRF, and IFN were each constructed as listed closed-end country funds for Turkey, Mexico, Russia and Eastern Europe, and India. A closed-end country fund is a listed vehicle whose single traded price packages the equities of one country or a tight regional group, so each series functions as a compact proxy for that market’s listed-equity regime.
Applied to all four series at once, the same 20-day and 50-day overlay plus a range-or-breakout reading was the only chart method on the strip.
The chart rules stay frozen
Moving-average location is whether price is holding above or below the 20-day and 50-day averages used as an explicit trend baseline. Range consolidation is a multi-month high-low band that contains price without a durable directional phase. Breakout confirmation is a move that leaves a long base or flattening-average zone and then holds on the far side of that boundary.
Those three checks were not rewritten for each country. The archive simply asked where each fund sat relative to the same averages and whether its band was still intact or had already been left.
What the shared checklist classified
After losing more than half its value in the closing months of 2000, TKF spent the period from spring 2001 oscillating between about 8 and 3.75, with only brief late-year rebounds in 2001, 2002, and 2003 rather than a lasting advance. The shared reading classified TKF as still range-bound, a range consolidation rather than a durable directional phase.
MXF recovered through 2003 after losing about half its value in 2002, retraced about half of that prior decline, and from early summer 2003 held above both its 20-day and 50-day moving averages. The checklist classified MXF as recovered and above both averages. That rebound is a prior-decline retracement, a stated fraction of the immediately preceding downswing, not yet a completed regime change.
TRF advanced from a late-summer 2002 low, crossed above its 20-day and 50-day moving averages in late spring 2003, and printed a four-and-a-half-year high in mid-October. The same overlay classified TRF as trending at a multi-year high.
IFN left a descending consolidation in place since early 2001 when it broke above flattening 20-day and 50-day moving averages in April 2003, then doubled from those April lows into the October highs. That is breakout confirmation: a confirmed post-breakout advance on the far side of the old band.
Mexico Fund (MXF) weekly price with 20-day and 50-day averages
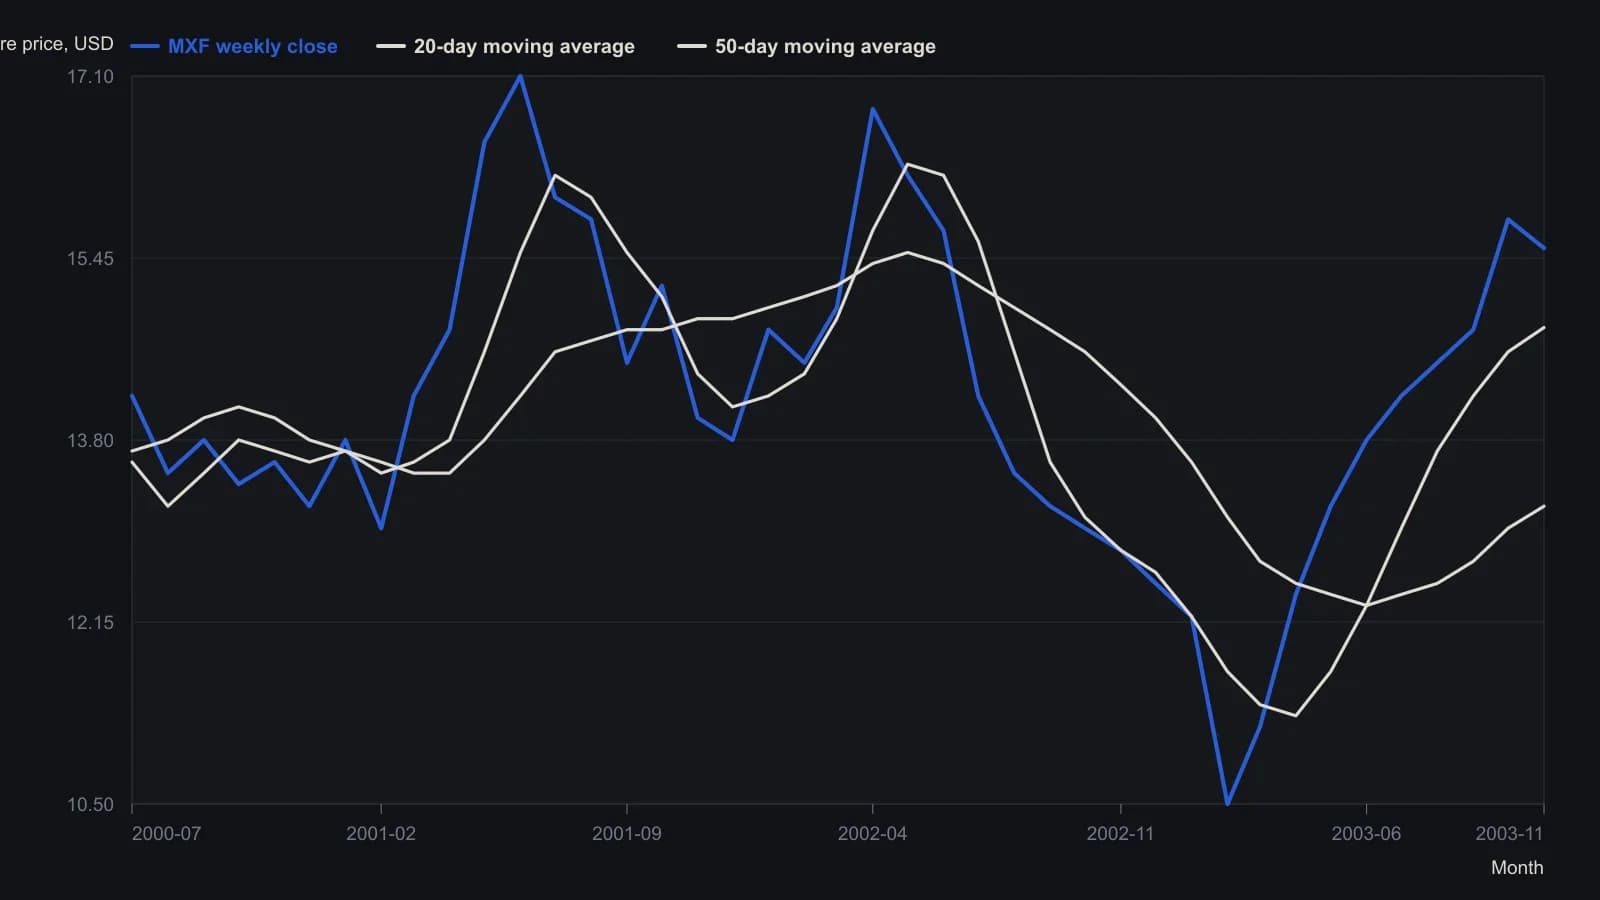
Monthly samples from a weekly bar chart. Prices are approximate to about 0.10 on a one-dollar grid except the three printed end quotes. The magazine names the overlays 20-day and 50-day even though the bars are weekly.
Structure still needs a local backdrop
An intermarket regime is the pairing of a country-fund price structure with that market’s inflation, policy, and legal backdrop. The four country backdrops were not interchangeable.
Turkey was framed around a loan-backed stabilization and a planned inflation decline. Mexico was framed around lower inflation and rates plus a deeper domestic debt market. Russia was framed around legal and political risk to large corporates. India was framed around firm domestic demand, contained inflation, and a surge of foreign equity buying.
Editorial reading: the moving-average and breakout checklist can classify four different regimes at once. Only the local pairing tells a portfolio which intermarket regime it is actually holding.
All readings on this track · 33 readings
- 1990Policy-auction spread as a weekly equity regime filter
- 1992Electric utilities as bond-regime context
- 1992Reading the dollar as a rates-regime check
- 1992Evaluating weekly intermarket context for equity regimes
- 1993Specifying the stock-bond yield gap as a hold-or-abstain regime
- 1996Constructing dual-gate bond-fund entries from gold-silver jumps
- 1996Name the regime before the sector breakout
- 2002Falling prices flip stock-bond confirmation
- 2003Four sleeves on one regime board: gold miners, REITs, bills, and equities
- 2003Four currency regimes for the yen, loonie, pound and Australian dollar
- 2003Read gold through the dollar regime, the hedge spread, and a stop
- 2003When deflation flips the stock-bond map
- 2003Commodity subgroup regime boards and dual averages
- 2003Reading a liquidity regime when gold, bonds, and stocks rise together
- 2003A shared weekly checklist for four country funds
- 2004Size-and-style sleeves as a weekly regime map
- 2004Country closed-end funds shared one average checklist and four regimes
- 2004A 2004 four-pair snapshot of a dollar-bloc FX regime
- 2005Country closed-end funds as a weekly regime comparison
- 2005Weekly regime maps for production-weighted commodity subgroups
- 2005Four technology sleeves on one weekly regime map
- 2006The Australian dollar as a commodity regime and timing filter
- 2008Dual-listing moving averages as a crowd-regime test
- 2008Cross-market regime context for a single trade
- 2010Dollar index, cross rates, and commodity context for forex targets
- 2010Gold and silver forex session candles as metals-regime context
- 2012Yield curve regime and equity timing
- 2013Yield curve shapes as stock market regime context
- 2013Yield spreads as country-specific equity regime context
- 2016Credit spreads as an equity cash regime filter
- 2016The summer lull is a context error
- 2019Financial sector spreads as regime tells around a global stablecoin
- 2019The negative-yield regime as an equity intermarket filter