2019issue C1037
The negative-yield regime as an equity intermarket filter
More than 17 trillion dollars of instruments were held at negative yields, so holders would receive less than their original principal if those positions were held to maturity. This article treats that multi-country tape as a weeks-to-months intermarket-filter: any single equity or futures idea belongs inside the carry and duration context implied by listed bond prices, not inside a story that policy rates will climb back to a familiar higher range.
- A negative-yield-regime is a market state in which a large stock of government and corporate debt is priced to return less than the amount invested if held to maturity.
- Listed bond prices, yields, and carry work as an intermarket-filter that independently checks equity and futures assumptions about growth, inflation, and policy.
- Carry includes the holding cost of cash, deposits, or duration when savings or deposit rates are negative, so a single idea sits inside that duration context.
- The object to read is the policy-price-gap: the divergence between a rate-normalization narrative and what listed government-bond prices are discounting.
What a negative-yield-regime is
More than 17 trillion dollars of instruments were held at negative yields, so holders would receive less than their original principal if those positions were held to maturity.
Editorial interpretation: that stock of government and corporate debt is the negative-yield-regime used here. It is a market state defined by listed prices, not by a later return to a familiar higher range.
Where the government-bond tape was negative
Switzerland was described as having negative yields on all listed government-bond maturities, including the 50-year tenor. Germany and the Netherlands were described as having negative yields on government bonds through the 30-year tenor. Japanese government bonds were said to account for more than 42 percent of globally negative-yielding debt.
Editorial interpretation: the intermarket-filter is the multi-country tape taken together. A single domestic rate story is not a substitute for that listed map.
How far out government yields were still negative
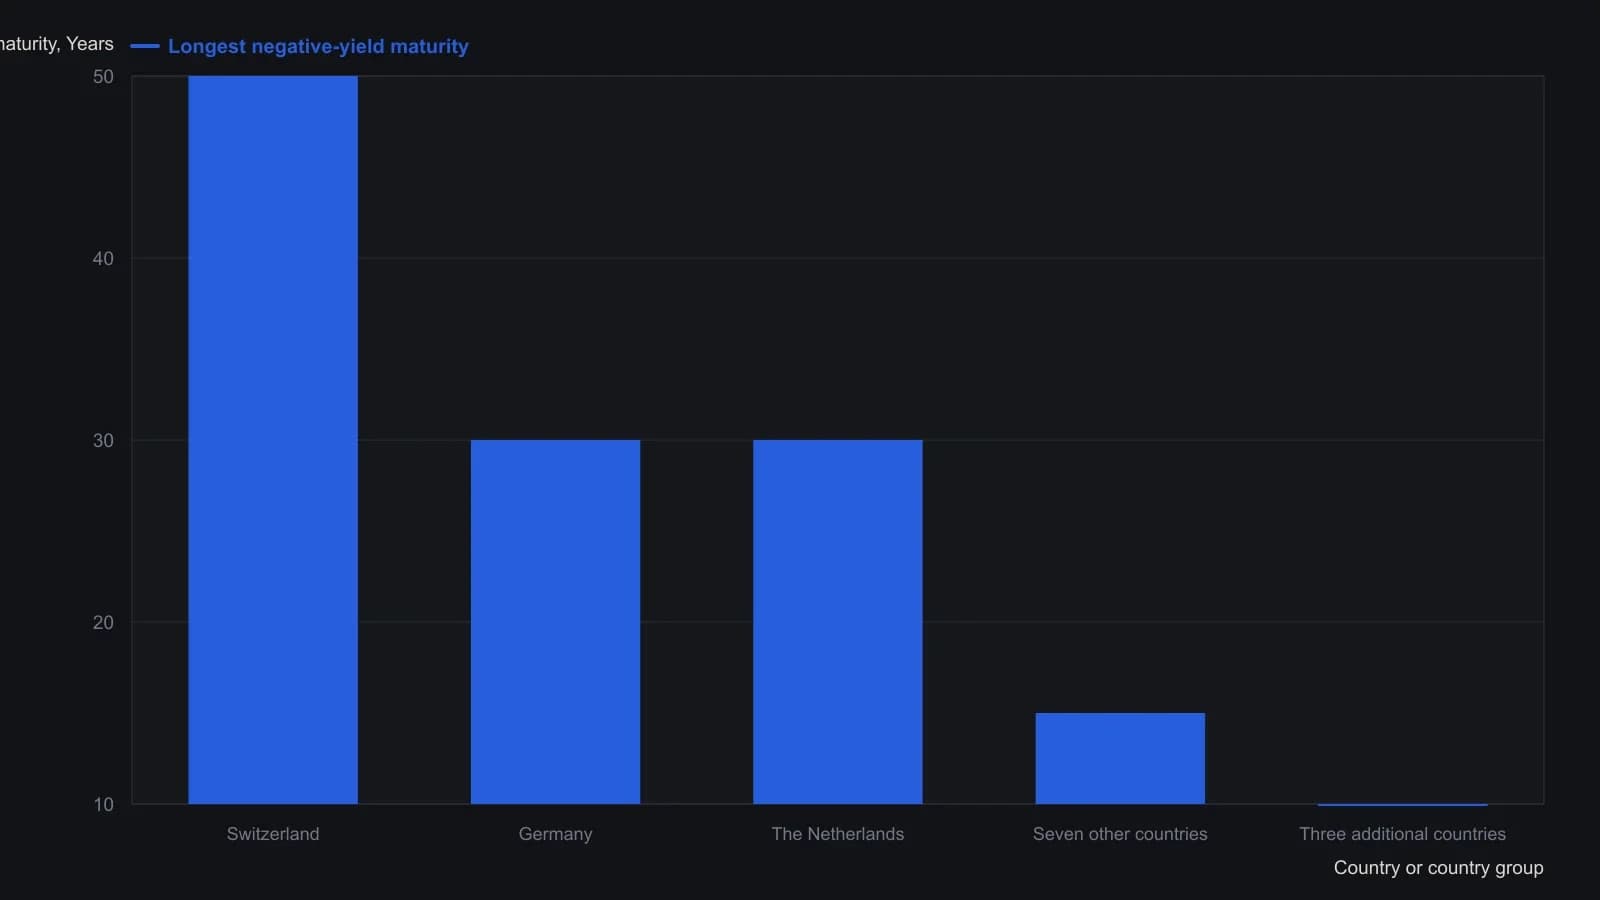
Six further countries were described as negative at some unspecified maturities and are omitted because no cutoff was given. Japan was cited as over 42 percent of global negative-yielding debt, also without a maturity cutoff.
Carry when income is a holding cost
Negative-yielding government and corporate bonds were still attracting additional capital even as those yields moved lower. Illustrative figures included Swiss savings rates near minus 1.0 percent and Danish mortgage rates near minus 0.5 percent.
Editorial interpretation: carry is the income or holding cost of cash, deposits, or duration over time, including when that cost is a negative savings or deposit rate. Extra capital arriving as yields move lower is part of the regime, not a reason to set the tape aside.
Listed prices versus the normalization story
Listed bond trading was presented as repeatedly skeptical of a then-common view that policy rates would climb back to a more familiar, higher range. A deflationary backdrop of excess money and goods was used to argue that interest rates, including in the United States, should continue to fall rather than normalize higher.
Editorial interpretation: that split is the policy-price-gap. The independent check on equity and futures assumptions about growth, inflation, and policy is what listed government-bond prices are discounting. The archive argument that rates should keep falling is historical context. It is not a present-day forecast.
Cash-leakage as a policy constraint
Proposals to split cash and electronic money were framed as a response to physical currency that cannot be charged a negative deposit rate.
Editorial interpretation: that constraint is cash-leakage. Physical currency held outside the banking system cannot be charged a negative deposit rate without extra policy design, so listed carry on deposits and bonds need not match a simple official-rate story.
Using the tape as a weeks-to-months filter
Editorial interpretation: once the tape is read as a negative-yield-regime, a single equity or futures idea is not judged in isolation. It is placed inside the carry and duration context already implied by government and corporate bond prices. That context is a weeks-to-months market-regime reading, not a one-session headline about rates returning to a familiar higher range.
All readings on this track · 33 readings
- 1990Policy-auction spread as a weekly equity regime filter
- 1992Electric utilities as bond-regime context
- 1992Reading the dollar as a rates-regime check
- 1992Evaluating weekly intermarket context for equity regimes
- 1993Specifying the stock-bond yield gap as a hold-or-abstain regime
- 1996Constructing dual-gate bond-fund entries from gold-silver jumps
- 1996Name the regime before the sector breakout
- 2002Falling prices flip stock-bond confirmation
- 2003Four sleeves on one regime board: gold miners, REITs, bills, and equities
- 2003Four currency regimes for the yen, loonie, pound and Australian dollar
- 2003Read gold through the dollar regime, the hedge spread, and a stop
- 2003When deflation flips the stock-bond map
- 2003Commodity subgroup regime boards and dual averages
- 2003Reading a liquidity regime when gold, bonds, and stocks rise together
- 2003A shared weekly checklist for four country funds
- 2004Size-and-style sleeves as a weekly regime map
- 2004Country closed-end funds shared one average checklist and four regimes
- 2004A 2004 four-pair snapshot of a dollar-bloc FX regime
- 2005Country closed-end funds as a weekly regime comparison
- 2005Weekly regime maps for production-weighted commodity subgroups
- 2005Four technology sleeves on one weekly regime map
- 2006The Australian dollar as a commodity regime and timing filter
- 2008Dual-listing moving averages as a crowd-regime test
- 2008Cross-market regime context for a single trade
- 2010Dollar index, cross rates, and commodity context for forex targets
- 2010Gold and silver forex session candles as metals-regime context
- 2012Yield curve regime and equity timing
- 2013Yield curve shapes as stock market regime context
- 2013Yield spreads as country-specific equity regime context
- 2016Credit spreads as an equity cash regime filter
- 2016The summer lull is a context error
- 2019Financial sector spreads as regime tells around a global stablecoin
- 2019The negative-yield regime as an equity intermarket filter