2003issue C061-5
Read gold through the dollar regime, the hedge spread, and a stop
This archive case treats a single-metal stance as a portfolio-context problem. It maps the dollar regime, the producer-hedge spread, and the lease-carry short book first, then converts only the leftover chart shelf into a support-resistance hypothesis that a stop-loss can falsify.
- Map the dollar regime, the producer-hedge spread, and the lease-carry short book before treating a gold chart shelf as a stance.
- Gold was framed as declining while the dollar and equities rose together, and as rising when both of those markets weakened.
- Heavily hedged miner shares were described as able to move opposite the metal once price exceeded the hedge, so the producer-hedge spread belongs in the portfolio map.
- The case required predefined price objectives and stop-loss bounds so a failed dollar shelf or gold level could exit the stance.
A single-metal stance is a portfolio-context problem
A weekly gold-futures composite recorded a July 1999 low at 252.90, with later observed reference areas at 305 and 350. Gold moved above 305 in April 2002, briefly lost that level in July, and printed 350 on 30 December 2002.
The case ordered dollar-linked fundamentals ahead of chart confirmation and required predefined price objectives together with stop-loss bounds around any gold or gold-equity stance. An editorial reading is that the metal is not the starting object. Intermarket analysis means reading gold against the dollar, equities, rates, and related commodities so one metal stance sits inside a broader market regime.
COMEX gold daily from the 2001 low through the $350 hold
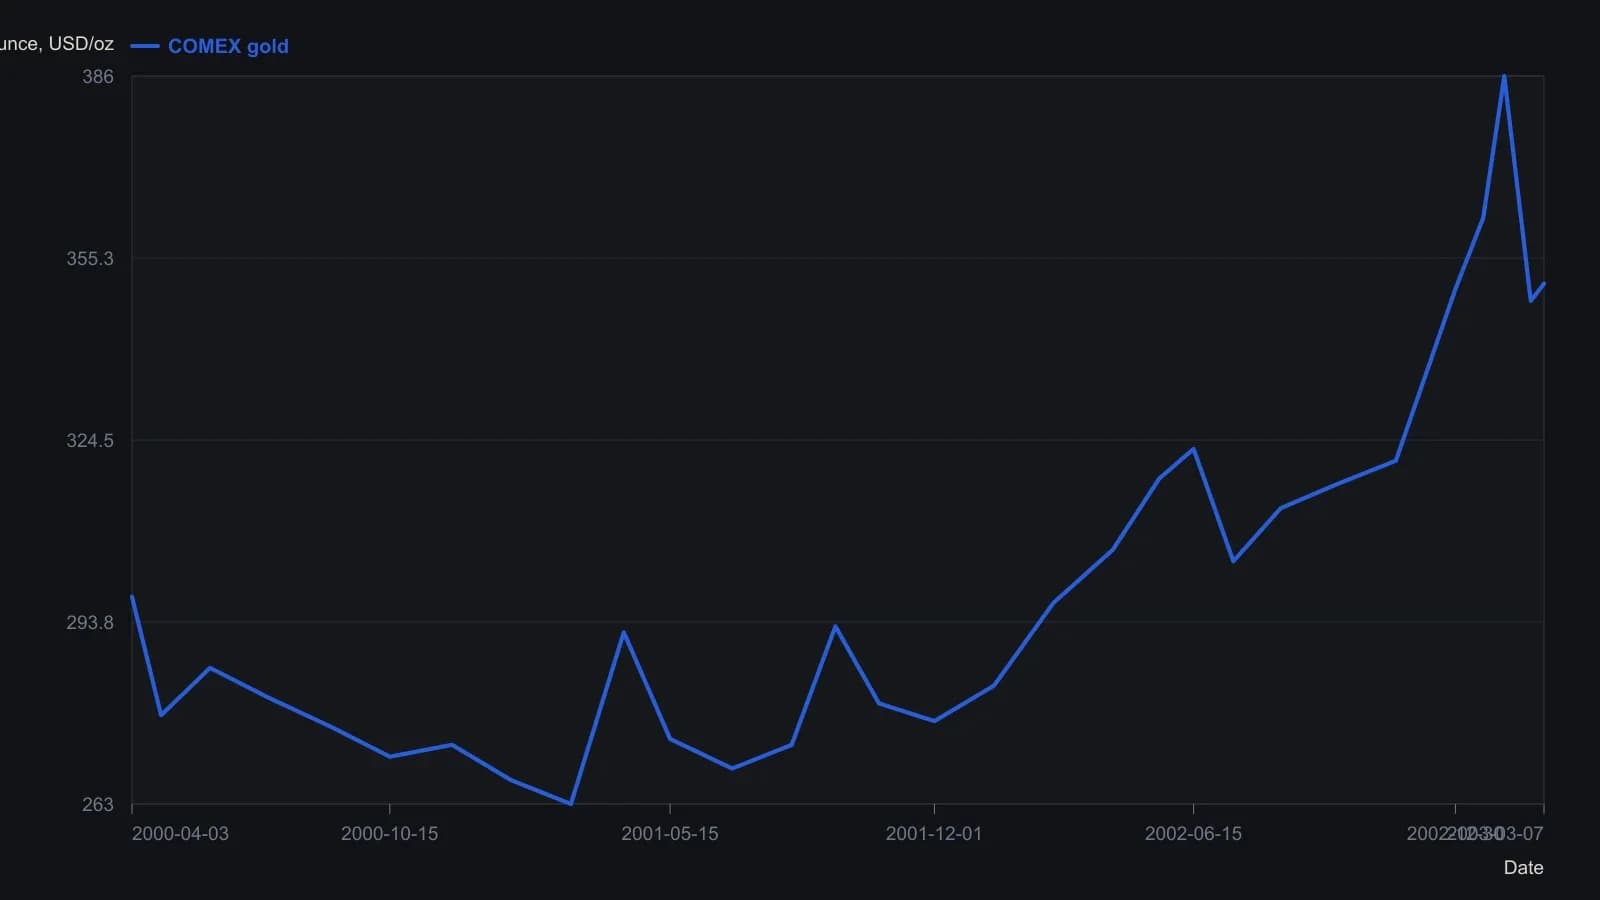
Daily gold pane only. The lower Gold Com long/short spread is a flat unused trace and was not read. Raster prices are to about the nearest two dollars except the printed 7 March 2003 close.
The dollar and equity regime
Gold was framed as typically declining while the dollar and equities rose together, and as rising when both of those markets weakened. A December 2002 US trade deficit of 40 billion, described as more than 5 percent of GDP on an annualized basis, was listed among the dollar-weakening conditions that accompanied the gold advance.
The US dollar index was shown with long-term support at 97.8. A rebound from that shelf was treated as bearish for gold, while a fade in war-related uncertainty was listed as a path back toward 300 or lower. In editorial terms, that dollar floor is support and resistance: a long-term dollar-index floor that turns the regime view into a price level that can be confirmed or rejected.
The producer-hedge spread and the lease-carry book
Hedged and unhedged gold-producer indexes were said to diverge from mid-2001 as gold approached 270 on the way above 300. Heavily hedged miner shares were described as able to move opposite the metal once price exceeded the hedge. The producer-hedge spread is the gap between those indexes, or between a hedged miner and a gold-equity basket, used to see when the stock no longer tracks the metal.
Gold-derivative shorts were reported at 279 billion in June 2002, up from 231 billion in December 2001, with mine-producer hedges described as 11 percent of the outstanding book. An editorial reading names the off-exchange derivative book the lease-carry book: off-exchange gold borrows used to fund non-gold books at a low lease rate, creating a short that later covering can force higher if the metal rises.
Commercial shorts in the official futures positioning report were presented as often mirroring gold's path, and as small next to the off-exchange derivative book that the futures tally did not capture. Commercial positioning is that reported industry and dealer futures short. It often tracks gold as a hedge rather than as an independent directional bet.
Only then convert a shelf into a hypothesis
Support and resistance on the metal itself was the prior gold ceiling left after the regime map: the 305 area, then 350. An editorial reading is that those shelves become a support-resistance hypothesis only after the dollar regime, the producer-hedge spread, and the lease-carry book are already in view.
A stop-loss is a pre-set exit that keeps a gold or gold-equity stance bounded if the dollar regime or the chosen price shelf fails. The archive case required that bound, and the price objective, before the chart was used as confirmation.
All readings on this track · 33 readings
- 1990Policy-auction spread as a weekly equity regime filter
- 1992Electric utilities as bond-regime context
- 1992Reading the dollar as a rates-regime check
- 1992Evaluating weekly intermarket context for equity regimes
- 1993Specifying the stock-bond yield gap as a hold-or-abstain regime
- 1996Constructing dual-gate bond-fund entries from gold-silver jumps
- 1996Name the regime before the sector breakout
- 2002Falling prices flip stock-bond confirmation
- 2003Four sleeves on one regime board: gold miners, REITs, bills, and equities
- 2003Four currency regimes for the yen, loonie, pound and Australian dollar
- 2003Read gold through the dollar regime, the hedge spread, and a stop
- 2003When deflation flips the stock-bond map
- 2003Commodity subgroup regime boards and dual averages
- 2003Reading a liquidity regime when gold, bonds, and stocks rise together
- 2003A shared weekly checklist for four country funds
- 2004Size-and-style sleeves as a weekly regime map
- 2004Country closed-end funds shared one average checklist and four regimes
- 2004A 2004 four-pair snapshot of a dollar-bloc FX regime
- 2005Country closed-end funds as a weekly regime comparison
- 2005Weekly regime maps for production-weighted commodity subgroups
- 2005Four technology sleeves on one weekly regime map
- 2006The Australian dollar as a commodity regime and timing filter
- 2008Dual-listing moving averages as a crowd-regime test
- 2008Cross-market regime context for a single trade
- 2010Dollar index, cross rates, and commodity context for forex targets
- 2010Gold and silver forex session candles as metals-regime context
- 2012Yield curve regime and equity timing
- 2013Yield curve shapes as stock market regime context
- 2013Yield spreads as country-specific equity regime context
- 2016Credit spreads as an equity cash regime filter
- 2016The summer lull is a context error
- 2019Financial sector spreads as regime tells around a global stablecoin
- 2019The negative-yield regime as an equity intermarket filter